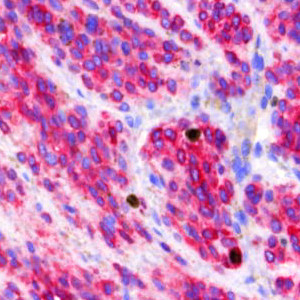
Field of view showing malignant melanoma in an image of skin tissue double stained by IHC for Ki-67 (DAB) and MART1 (Fast Red).
#10005
The Ki-67 protein is associated with cellular proliferation, and the protein is present in the nucleus of all cells that are in the active phase of the cell cycle, but absent in resting cells, see [1]. The cell proliferation rate can be assessed by Ki-67-immunohistochemical (IHC) staining, and this can be correlated to the tumor grade and the clinical course for the patient, see [2]. For melanocytic lesions, the number and distribution of Ki-67-positive cells can be used to differentiate melanomas from nevi, because the number of positive cells is significantly increased in melanomas compared to nevi, see [3]. However, prominent lymphatic infiltrate is often present in melanomas and nevi, which may make it difficult to distinguish the two from each other. To make sure that the Ki-67 staining patterns are not misinterpreted, an IHC cocktail detecting both Ki-67 and the melanocytic marker Melanoma Antigen Recognized by T-cells (MART1, sometimes also called MelanA) can be used to distinguish Ki-67-positive melanocytes from Ki-67-positive non-melanocytes, see [3].
This protocol automatically detects and quantifies Ki-67 positive cells within tumor regions. No manual outlining of the tumor is needed, since the tumor region is automatically identified based on the Ki-67/MART1-IHC double staining. Thus, only an overall region of interest (ROI) has to be defined. The protocol provides the number of positive nuclei within the tumor region as well as the ratio compared to the total number of nuclei within the tumor region.
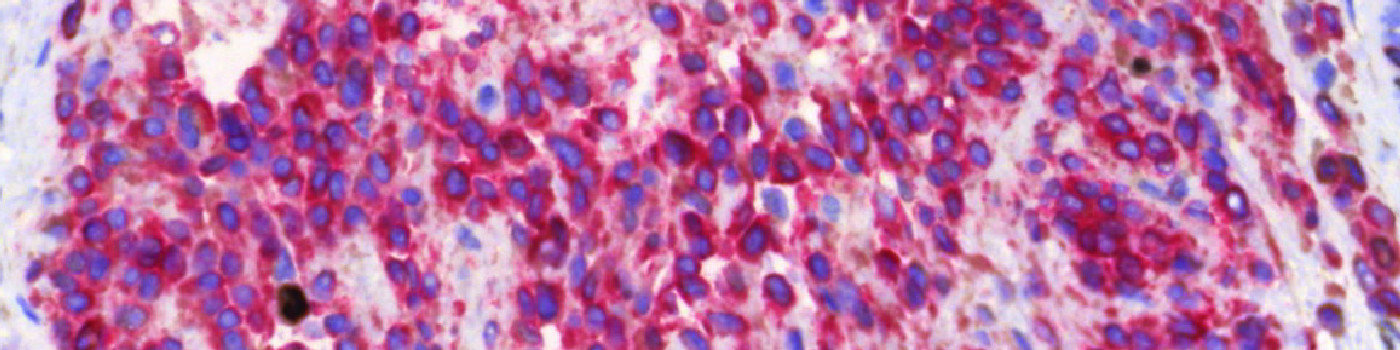
Field of view showing malignant melanoma in an image of skin tissue double stained by IHC for Ki-67 (DAB) and MART1 (Fast Red).
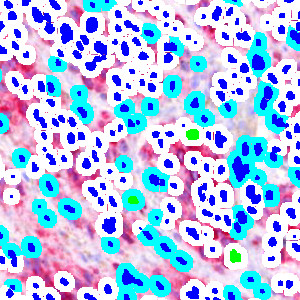
The same field of view as in Figure 1 after automatic segmentation of nuclei and cytoplasm: DAB-stained Ki-67-positive nuclei (green label), hematoxylin-stained Ki-67-negative nuclei (blue label), Fast red-stained MART1-positive cytoplasm (white label), and unstained MART1-negative cytoplasm (turquoise label).
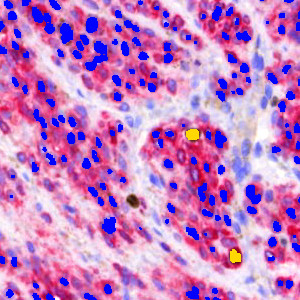
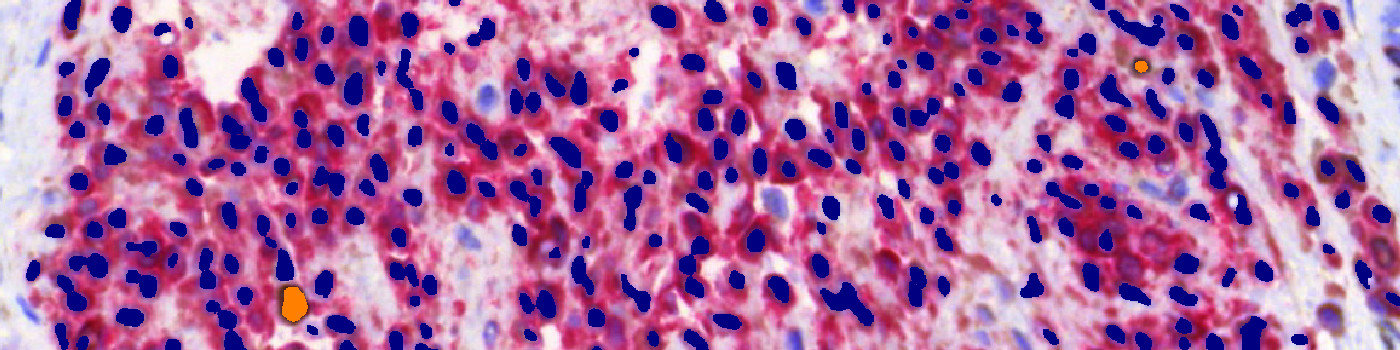
The same field of view as in Figure 1 after specific classification of nuclei surrounded by MART1-positive cytoplasm: Ki-67-positive tumor nuclei (yellow label), and Ki-67-negative tumor nuclei (blue label).
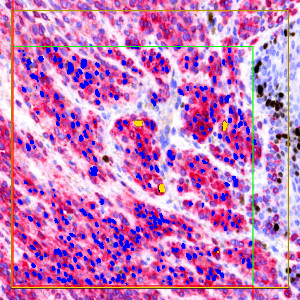
A field of view comparable to that of Figure 1 including an un-biased counting frame in order to ensure that tumor nuclei are counted only once.
Quantitative Output variables
The output variables obtained from this protocol include:
Methods
The first image processing step involves a segmentation of all nuclei. This is done by assigning a label probability to all pixels in the image, resulting in a label probability image. The label probability image is found by an intensity dictionary – a dictionary with small image patches. The intensity dictionary can be coupled to a label dictionary from which the label probability image is obtained. Based on this image, segmentation of nuclei can be done by choosing the most probable label in each pixel, see [4]. A method for nuclei separation which is based on shape, size and nuclei probability is used, employing a fully automated watershed-based nuclei segmentation technique. The method is an extension of the method of Jung and Kim, see [5], where an h-minima transform is used before applying the watershed. The nuclei are subsequently divided into positively stained nuclei and negatively stained nuclei. In addition, the cytoplasm surrounding the nuclei is found and segmented into tumor areas and non-tumor areas depending on the staining level of the cytoplasm (see FIGURE 2). Next, nuclei with an even brown reaction surrounded by cytoplasm that has been classified as belonging to a tumor region are identified as positive nuclei. Furthermore, as a post-processing step, nuclei that are too small are removed. The image obtained after post-processing (see FIGURE 3) is used to determine the output variables.
Note on counting: Analysis of full virtual slides takes place in a tile-by-tile fashion. If not handled appropriately, nuclei that are intersecting with neighboring tile boundaries would be counted twice (or more). By using unbiased counting frames, see [7], this can be avoided (see FIGURE 4). This principle is implemented in the present APP. Depending on the size of nuclei, the application of this principle could make an important difference.
Keywords
Ki-67, Ki67, MART1, double staining, melanoma, proliferation, quantitative, digital pathology, image analysis.
References
LITERATURE
1. Scholzen, T., et. al. The Ki-67 protein: from the known and the unknown, J. Cell Physiol 2000, 182 (3), 311-22, DOI
2.NordiQC Protocol Ki67 (Last updated: 02.07.09).
3. Nielsen, P.S., et. al. Immunohistochemical Double Stains Against Ki67/MART1 and HMB45/MITF: Promising Diagnostic Tools in Melanocytic Lesions, Am J Dermatopathol. 2011, 33 (4), 361-70, DOI
4. Dahl, A.L, et. al. Learning Dictionaries of Discriminative Image Patches, British Machine Vision Conference 2011, DOI
5. Jung, C., et. al. Segmenting Clustered Nuclei Using H-minima Transform-Based Marker Extraction and Contour Parameterization, IEEE Transactions on Biomedical Engineering 2010, 57 (10), 2600-4, DOI
6. Kårsnäs, A., et. al. Learning histopathological patterns, Journal of Pathology Informatics 2011, 2 (2), S12, DOI
7. Howard, C.V., Reed, M.G. (2005). Unbiased Stereology: Three-dimensional measurement in microscopy. QTP Publications.