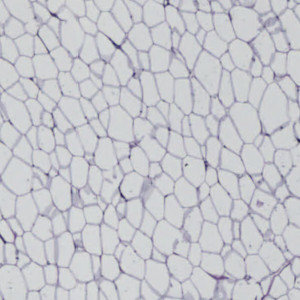
Adipose tissue.
#10113
This protocol can be used to evaluate the homo- or heterogeneity of adipose tissue based on size and shape of the cells. The protocol consists of three individual APPs with outputs related to the membrane-to-cell ratio, the size of cells, and the shape of cells, respectively.
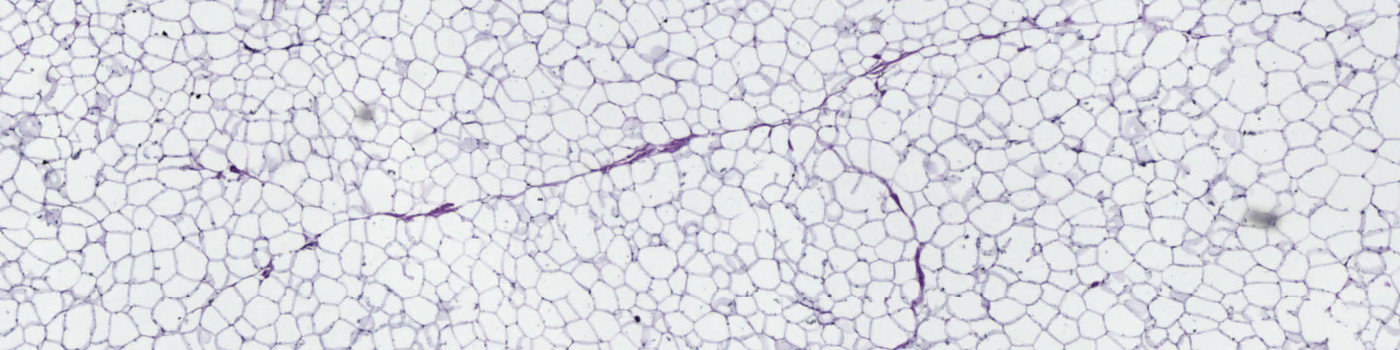
Adipose tissue.
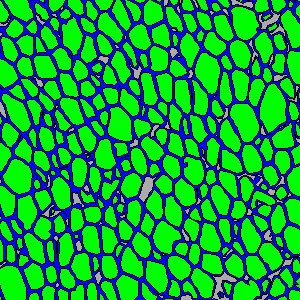
Membranes and Cells detected by the APP “02 Quantify Fat Cell Membranes”.
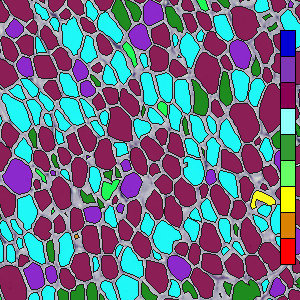
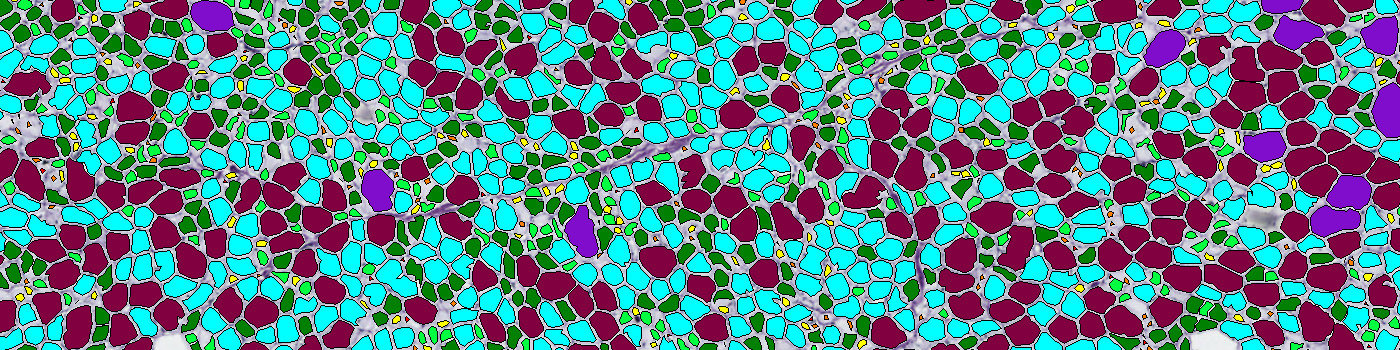
Adipose cells classified based on Form Factor using the APP “04 Quantify Fat Cell Shapes”. Classes range from a Form Factor value of 0 (red) to 1 (dark blue), as indicated by the color bar.
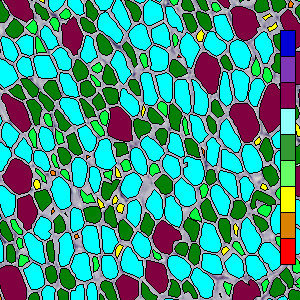
Adipose cells classified based on area using the APP “03 Quantify Fat Cell Sizes”. Classes range from an Area of 60 µm2 (red) to 36000 µm2 (dark blue), as indicated by the color bar.
Auxiliary APPs
The auxiliary APP “01 Exclude Background” is used for an automatic outline of tissue areas.
Quantitative Output variables
The output variables obtained from the three APPs include:
APP: 02 QUANTIFY FAT CELL MEMBRANES
Pct Cells: Percentage of Cell area
Pct Membrane: Percentage of Membrane area
Pct Removed Cells: Percentage of Removed Cell area
APP: 03 QUANTIFY FAT CELL SIZES
Pct under 200: Percentage of Cells with an area smaller than 200 µm2
Pct under 400: Percentage of Cells with an area larger than 200 µm2 and smaller than 400 µm2
Pct under 800: Percentage of Cells with an area larger than 400 µm2 and smaller than 800 µm2
Pct under 1600: Percentage of Cells with an area larger than 800 µm2 and smaller than 1600 µm2
Pct under 3200: Percentage of Cells with an area larger than 1600 µm2 and smaller than 3200 µm2
Pct under 6400: Percentage of Cells with an area larger than 3200 µm2 and smaller than 6400 µm2
Pct under 12800: Percentage of Cells with an area larger than 6400 µm2 and smaller than 12800 µm2
Pct under 25600: Percentage of Cells with an area larger than 12800 µm2 and smaller than 25600 µm2
Pct under 36000: Percentage of Cells with an area larger than 25600 µm2 and smaller than 36000 µm2
APP: 04 QUANTIFY FAT CELL SHAPES
Pct under 0.2: Percentage of Cells with a Form Factor smaller than 0.2
Pct under 0.3: Percentage of Cells with a Form Factor larger than 0.2 and smaller than 0.3
Pct under 0.4: Percentage of Cells with a Form Factor larger than 0.3 and smaller than 0.4
Pct under 0.5: Percentage of Cells with a Form Factor larger than 0.4 and smaller than 0.5
Pct under 0.6: Percentage of Cells with a Form Factor larger than 0.5 and smaller than 0.6
Pct under 0.7: Percentage of Cells with a Form Factor larger than 0.6 and smaller than 0.7
Pct under 0.8: Percentage of Cells with a Form Factor larger than 0.7 and smaller than 0.8
Pct under 0.9: Percentage of Cells with a Form Factor larger than 0.8 and smaller than 0.9
Pct under 1.0: Percentage of Cells with a Form Factor larger than 0.9 and smaller than 1.0
Workflow
If results from all three APPs are needed, the workflow could be:
Step 1: Create a database e.g. named “My Database”.
Step 2: Load in your data three times in three folders named e.g. “Membrane”, “Shape”, and “Size”.
Step 3: Automatically outline tissue in the images using the auxiliary APP “01 Exclude Background” and manually correct if needed.
Step 4: Run the APP “02 Quantify Fat Cell Membranes” on the data in the folder “Membrane”.
Step 5: Run the APP “04 Quantify Fat Cell Shapes” on the data in the folder “Shape”.
Step 6: Run the APP “03 Quantify Fat Cell Sizes” on the data in the folder “Size”.
The three APPs can be run separately, if not all results are required, or simultaneously as a batch process if the visual results are of less importance.
Methods
All three APPs consist of a threshold segmentation of the membrane, extracellular matrix (ECM), and adipose cell area. The cell area is divided into reasonably sized cells based on the segmented membrane. Cell areas larger than 36000 µm2 are excluded. The three APPs utilize the resulting cells and membranes to calculate different outputs. The first APP calculates the membrane-to-cell ratio. The other two APPs classify the adipose cells into nine classes based on size and shape, respectively. The size-measure is area and the shape-measure is Form Factor. Form factor is a measure of the circularity of the object, ranging from 0, being a line, to 1, being a perfect circle (see VIS Help Manual for more information). The adipose cells are quantified by size and shape individually.
Staining Protocol
There is no staining protocol available.
Keywords
Adipose tissue, obesity, iron hematoxylin, quantification, image analysis.
References
USERS
The APP was developed for Professor MSO Mette Olaf Nielsen and Sharmila Binti Ahmad, Department of Veterinary and Animal Sciences, University of Copenhagen.
LITERATURE
There are currently no references.