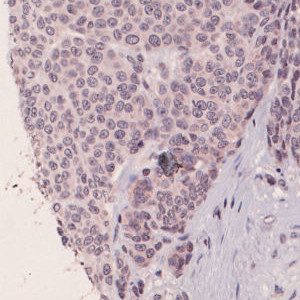
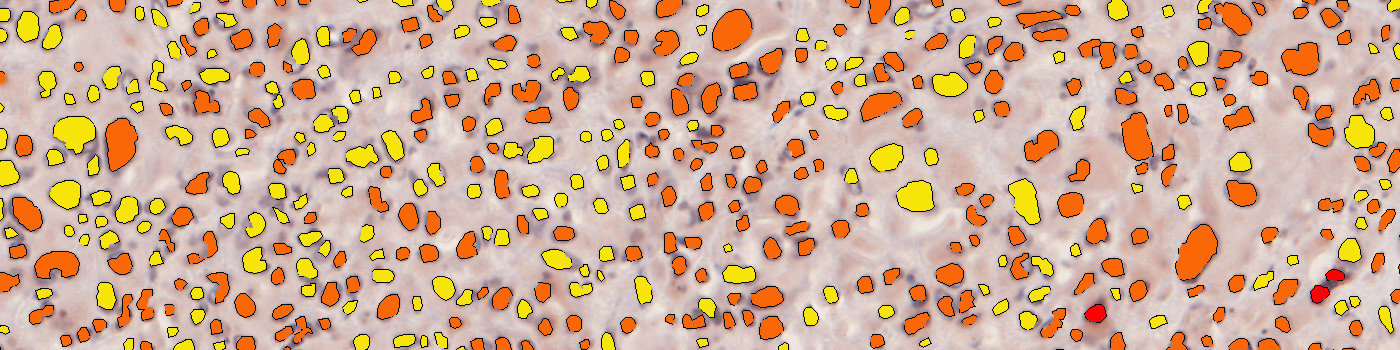
Nuclei surrounded by iNOS intermediate and low staining.
#10134
iNOS (inducible nitric oxide synthase) protein expression is a well-studied predictor of poor outcome in multiple cancers, and it has also been associated with inflammatory and immunosuppressive processes in the tumor microenvironment. Its expression and nitric oxide (NO) production lead to tumor progression by modulation of effector T-cell activity, and its overexpression may allow the tumor to escape the immune response through creating a microenvironment which causes resistance to immunotherapy.
The “10134 – iNOS, Melanoma, TME” APP detects nuclei and classifies them as either negative, 1+, 2+ or 3+ based on the iNOS staining expression present in each nucleus’ vicinity.
Nuclei surrounded by iNOS intermediate and low staining.
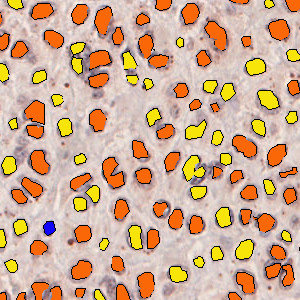
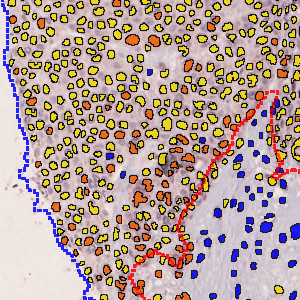
Nuclei classified as negative (blue) 1+ (yellow) or 2+ (orange) based on the iNOS staining present in each nucleus’ vicinity.
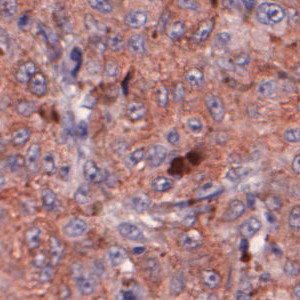
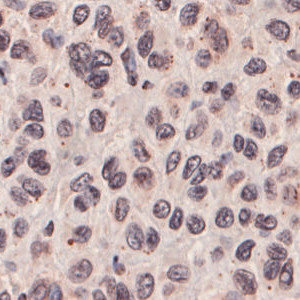
Nuclei surrounded by iNOS high and intermediate staining.
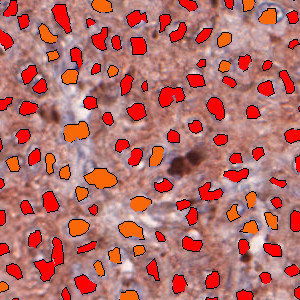
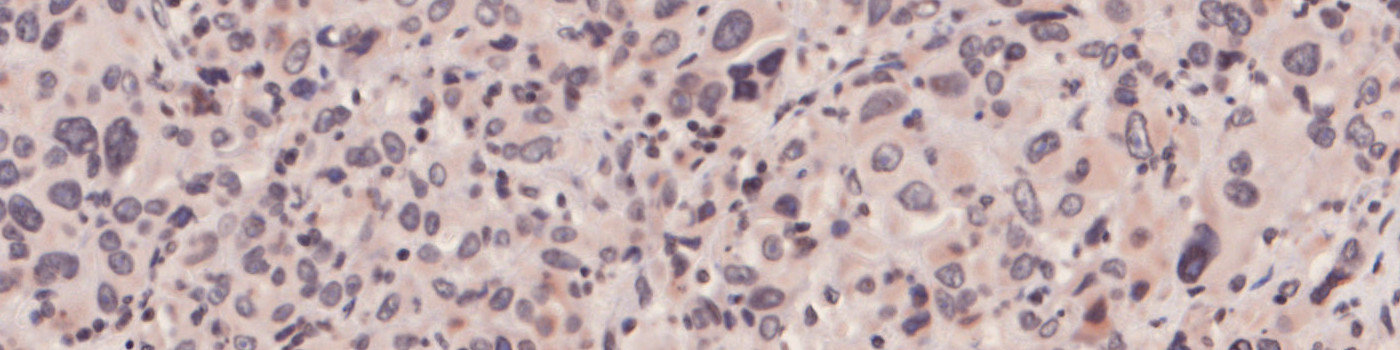
Nuclei classified as 2+ (orange) or 3+ (red) based on the iNOS staining present in each nucleus’ vicinity.
Quantitative Output variables
The output variables obtained from this protocol include:
Workflow
Step 1: Load and run the APP “01 Detect TumorStroma” for tumor and stromal tissue identification. Manually correct the result if needed.
Step 2: Load and run the APP “02 iNOS Analysis” for the quantification of cells.
Methods
To identify the nuclei, the APP performs a two-stage polynomial blob filtering on a blue-enhanced feature image and delimits them using local linear filtering. Each pixel with DAB staining is classified as low, mid and high based on the intensity and grouped together locally. Each nucleus is then classified based on its surroundings in the order of 3+, 2+, 1+ and negative to emphasize the strongest staining present in each nucleus’ vicinity.
Staining Protocol
There is no staining protocol available.
Keywords
iNOS, inducible nitric oxide synthase, melanoma, skin, cancer, oncology, IHC, T-cell, tumor micro environment
References
LITERATURE
There are currently no references.