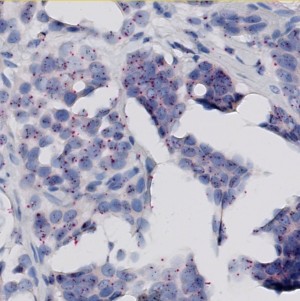
Field of view showing invasive tumor in an image of breast tissue stained by SISH for the HER2 gene (black signals) and the centromer of chromosome 17 (red signals).
#10039
The Human Epidermal Growth Factor Receptor 2 (HER2) is a central biomarker in invasive breast cancer, and the HER2 status has both important prognostic implications, and is predictive for the patient’s response to HER2-targeted treatment. According to the guidelines of the American Society of Clinical Oncology/College of American Pathologists (ASCO/CAP), the HER2 status must be determined by genetic and/or protein expression analysis of breast tissue sections using immunohistochemistry (IHC) and/or in situ hybridization (ISH), respectively.
The widely accepted ASCO/CAP recommendation for manual grading of breast cancer tissue sections stained by HER2 ISH is based on quantification of the HER2 gene amplification. Typically, the amplification is determined as the ratio between the number of HER2 gene probe signals and the number of centromer 17 probe signals within a selected tumor region. The ratio is divided into three intervals below 1.8, from 1.8 to 2.2, and above 2.2, corresponding to negative, equivocal, and positive for HER2 amplification, respectively.
The present protocol is based on the Visiopharm HER2 SISH algorithm, which by automated image analysis determines the HER2 amplification in brightfield digital images of breast cancer tissue sections stained by the INFORM™ HER2 Dual ISH assay from Ventana/Roche. This assay includes the HER2 Silver ISH (SISH) probe resulting in discrete or clustered small black signals, and the centromer 17 Fast Red ISH probe resulting in discrete red signals. The overall ratio of black to red signals constitutes the HER2 gene amplification. The amplification must be determined within regions of invasive tumor only, and as for the manual scoring method, the HER2 SISH algorithm therefore requires outlining of a relevant tumor region before the automated determination of signal numbers and amplification ratio.
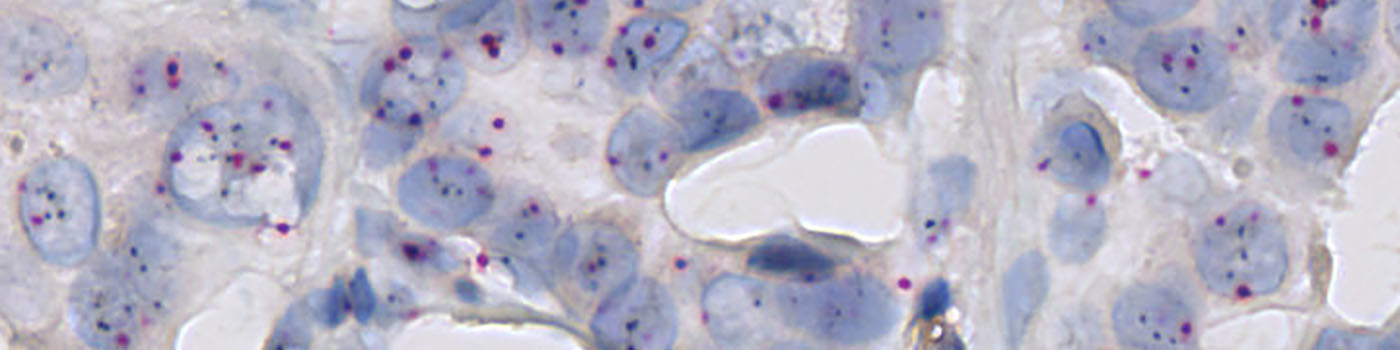
Field of view showing invasive tumor in an image of breast tissue stained by SISH for the HER2 gene (black signals) and the centromer of chromosome 17 (red signals).
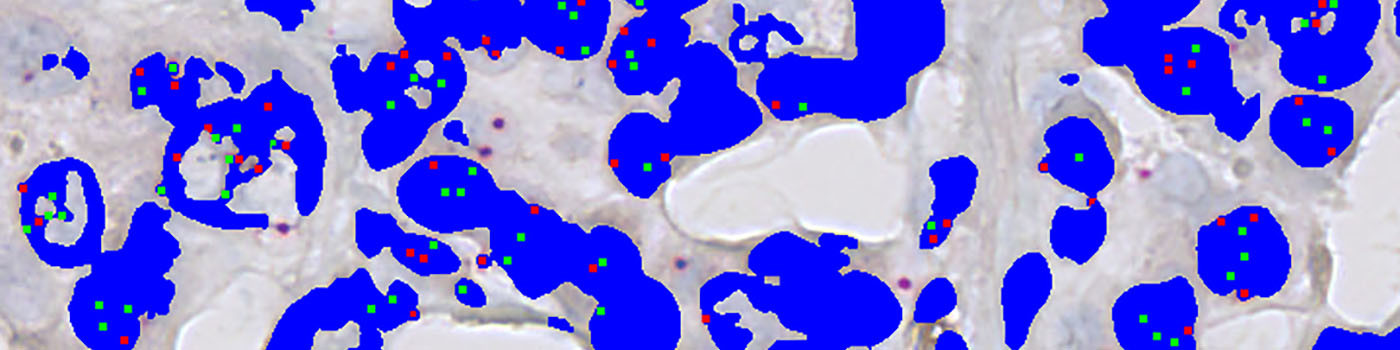
The same field of view as in FIGURE 1 after classification of the hematoxylin-stained nuclei (blue label), and those HER2 probe signals (red label) and Chromosome 17 signals (green label), which are permitted by being within nuclei and not too distant to an opposite signal.
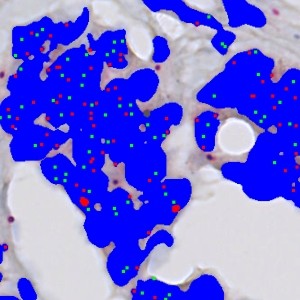
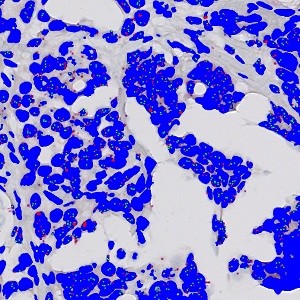
Zoomed in view to illustrate the final segmentation.
Quantitative Output variables
The output variables obtained from this protocol include:
Methods
The pre-processing steps for this APP are constructed so that the HER2 gene probe signals (black) can be distinguished from chromosome 17 probe signals (red) (see FIGURE 1). Polynomial blob filters are applied to the pre-processing steps to only identify round red or black objects as signals. To discriminate clusters of HER2 gene probe signals from individual signals, the area of black signals is determined. In addition, a haematoxylin color deconvolution is used to detect the nuclei in the image.
A threshold classifier is used to segment the image into nuclei and probe signals. Additionally, clusters of HER2 signals are also detected and segmented into small and large clusters. Subsequently, post-processing steps are used to clean up the image and remove probe signals that are outside nuclei. Probe signal are defined as being HER2 or Chromosome 17 signals depending on the intensity in the red-green color contrast. Another post-processing step ensures exclusion of HER2 signals that are more than 5 µm (this distance can be adjusted) from the nearest chromosome 17 signal, and vice versa. Examples of the segmentation is shown in FIGURE 2 and 3.
Keywords
HER2, silver in situ hybridization, brightfield, breast cancer, signal number, amplification ratio, dual, quantitative, digital pathology, image analysis.
References
USERS
Dept. of Pathology, Slagelse Hospital, DK-4200 Slagelse, Denmark:
LITERATURE
There are currently no references.