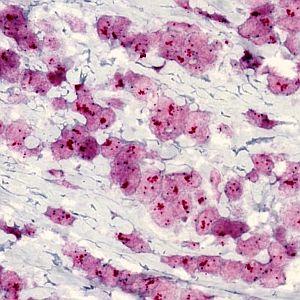
One field of view of the image at 40X (scaled down to fit this space).
#10034
The Human Epidermal Growth Factor Receptor 2 (HER2) is a central biomarker in invasive breast cancer, and the HER2 status has both important prognostic implications, and is predictive for the patient’s response to HER2-targeted treatment. According to the guidelines of the American Society of Clinical Oncology/College of American Pathologists (ASCO/CAP), the HER2 status must be determined by genetic and/or protein expression analysis of breast tissue sections using immunohistochemistry (IHC) and/or in situ hybridization (ISH), respectively, see [1].
The widely accepted ASCO/CAP recommendation for manual grading of breast cancer tissue sections stained by HER2 ISH is based on quantification of the HER2 gene amplification. Typically, the amplification is determined as the ratio between the number of HER2 gene probe signals and the number of centromer 17 probe signals within a selected tumor region. The ratio is divided into three intervals below 1.8, from 1.8 to 2.2, and above 2.2, corresponding to negative, equivocal, and positive for HER2 amplification, respectively.
The presented protocol is based on the Visiopharm HER2 CISH algorithm, which by automated image analysis determines the HER2 amplification in brightfield digital images of breast cancer tissue sections stained by the DuoCISH™ assay from DAKO. This assay includes the HER2 Texas Red probe resulting in discrete or clustered small red signals, and the centromer 17 FITC-labeled FISH probe resulting in discrete blue signals. The ratio of red to blue signals constitutes the HER2 gene amplification, which must be determined within regions of invasive tumor only. The HER2 CISH algorithm therefore requires outlining of a relevant tumor region before the automated determination of signal numbers and amplification ratio.
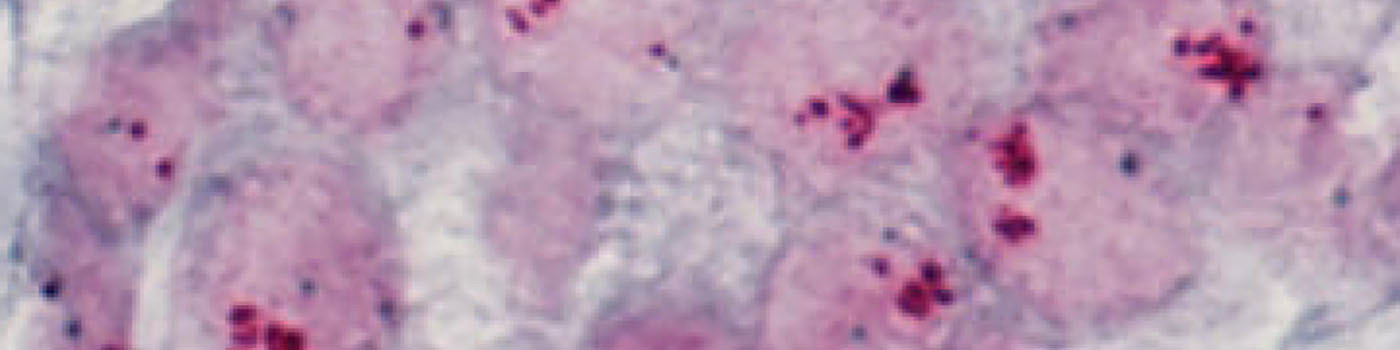
One field of view of the image at 40X (scaled down to fit this space).
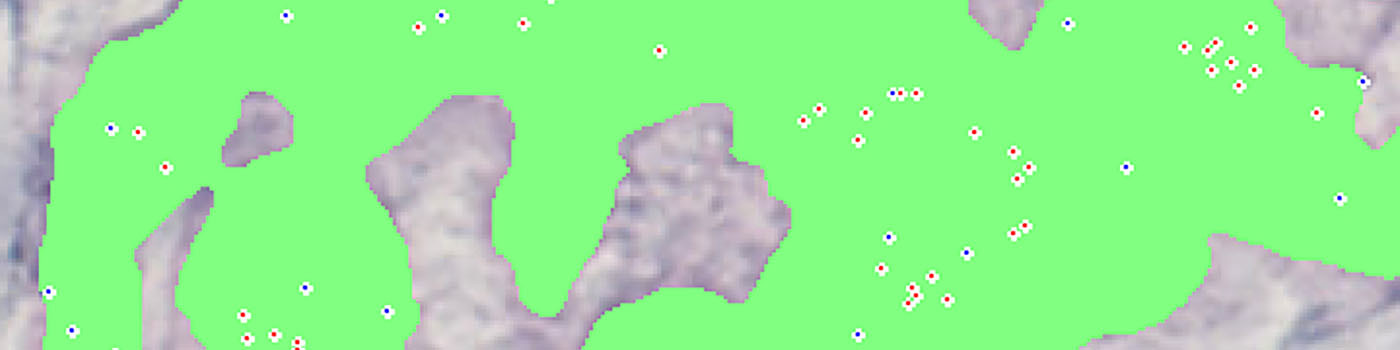
Field of view of the same part of the image as seen in Figure 1. A green label has been used to outline the nuclei, while the HER2 probe signals and Chromosome 17 signals are marked with a red and a blue label, respectively.
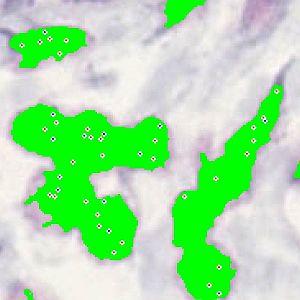
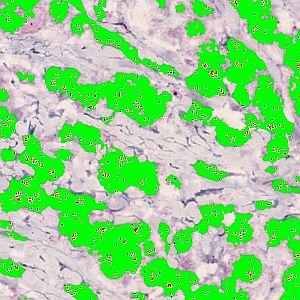
Zoomed in view to illustrate the final segmentation.
Quantitative Output variables
The output variables obtained from this protocol include the number of HER2 signals excluding counts from the clusters (HER2 (N)), the total number of HER2 signals including counts from the clusters (HER2 (N)), the number of Chromosome 17 signals (CHR 17 (N)) and the amplification ratio (AMPL RATIO):
Methods
The pre-processing steps for this APP is constructed to distinguish the HER2 gene probe signals (red) from the chromosome 17 probe signals (blue) (see FIGURE 1). The segmentation is done by assigning a label probability to all pixels in the image, resulting in a label probability image. The label probability image is found by an intensity dictionary – a dictionary with small image patches. The intensity dictionary can be coupled to a label dictionary from which the label probability image is obtained.
Based on this image, segmentation of probes can be done by choosing the most probable label in each pixel, see [3]. A method for probe separation which is based on shape, size and nuclei probability is used, employing a fully automated watershed-based nuclei segmentation technique. The method is an extension of the method in Jung and Kim, see [4], where an h-minima transform is used before applying the watershed.
Additionally, clusters of HER2 signals are also detected and segmented into small and large clusters. The final overlay of labels from this APP can be seen in FIGURE 2 and 3.
Additional information
The APP was developed in cooperation with Professor Mogens Vyberg from NordiQC and Aalborg University Hospital.
Keywords
CISH, ISH, HER2, chromogens, amplification, DuoCISH, DAKO
References
USERS
This APP was developed in cooperation with Professor Mogens Vyberg from NordiQC and Aalborg University Hospital.
LITERATURE
1. Hammond, M. E. H. et. al., American Society of Clinical Oncology/College of American Pathologists Guideline Recommendations for Immunohistochemical Testing of Estrogen and Progesterone Receptors in Breast Cancer, J. Clin Oncol 2010, 28 (16), 2784-95, DOI
2. Rogers, M. et. al., Advancing breast cancer HER2FISH quality by image analysis, San Antonio Breast Cancer Symposium 2009, 69 (24), 6015, DOI
3. Kårsnäs, A. et. al., Learning histopathological patterns, Journal of Pathology Informatics 2011, 2 (2), S12, DOI
4. Jung, C. et. al., Segmenting Clustered Nuclei Using H-minima Transform-Based Marker Extraction and Contour Parameterization, IEEE Transactions on Biomedical Engineering 2010, 57 (10), 2600-2604, DOI