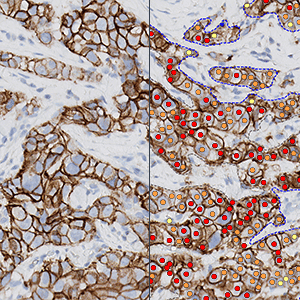
Patient tissue is automatically detected and separated from control tissue. Within the patient tissue, the invasive tumor is identified and normal tissue or non-invasive lesions are being ignored.
#90007
The Human Epidermal Growth Factor Receptor 2 (HER2) is a central biomarker in invasive breast cancer, and the HER2 status is predictive of the patient’s response to HER2-targeted treatment. According to the guidelines of the American Society of Clinical Oncology/College of American Pathologists (ASCO/CAP), the HER2 status must be determined by protein expression and/or genetic analysis of breast tissue sections using immunohistochemistry (IHC) and/or in situ hybridization (ISH), respectively.
The newest ASCO/CAP recommendation [1] for manual grading of breast cancer tissue sections stained by HER2 IHC includes four discrete scoring categories 0, 1+, 2+, and 3+, corresponding to negative (0,1+, 2+ non-amplified), and positive (2+ amplified and 3+) HER2-status. This scoring principle is based on the determination of ratios of numbers of cancer cells with various degrees of membrane completeness and intensity and therefore requires quantifications to be made restrictively within tumor regions, and avoiding contributions from stromal and other non-cancer cells.
Recent advances in antibody-drug conjugates (ADCs) have led to more focus on nuanced classifications of HER2-low (1+ and 2+ without gene amplification) and HER2-ultralow (detectable but less than 1+ and not HER2-null), supported by clinical evidence from trials like DESTINY-Breast04 [2] and DESTINY-Breast06 [3]. These classifications are derived from the expanded therapeutic landscape with treatment options like trastuzumab deruxtecan (T-DXd) for a broader patient population.
The present protocol is a fully automatic single-cell approach for HER2 IHC quantification that follows ASCO/CAP guidelines, designed with this new scoring regime in mind, i.e. HER2-low and HER2-ultra. It is also configurable to national modifications (e.g. UK Guideline [4]).
Advanced AI Algorithms: Our new APP utilizes AI/Deep Learning for everything from detecting tissue, removing artefacts, classifying cells, and segmenting HER2-positive membranes to be able to deliver highly accurate and consistent scoring, potentially reducing inter-observer variability.
Continuous HER2 Cell-based Scoring: This feature offers a nuanced and detailed analysis of HER2 expression, allowing for better differentiation between HER2-low and HER2-ultralow classifications while ensuring confidence in optimizing the 2+-rate to limit excessive expensive reflex testing.
Aligned with pathologist IHC scoring: The algorithm is defined to align closely with ASCO/CAP HER2 IHC guidelines for 0, 1+, 2+, and 3+ categorization, but still shows utility in lowering the manual 2+ rates by increasing the confidence of your 1+ scoring through optimization against FISH.
Seamless Integration: The APP integrates effortlessly with existing IT infrastructure and IMS/PACS, enhancing workflow efficiency and reducing adoption burdens. Learn more
Patient tissue is automatically detected and separated from control tissue. Within the patient tissue, the invasive tumor is identified and normal tissue or non-invasive lesions are being ignored.
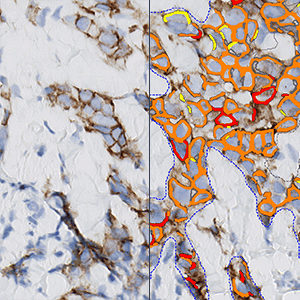
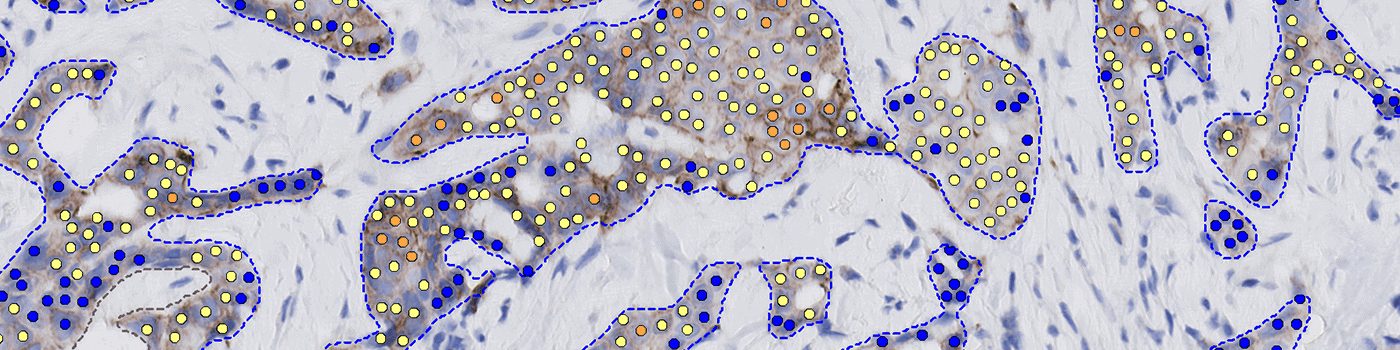
You won’t see this display, but under the hood, the system detects the cell membranes of the invasive tissue cells and grades the cells for circumference and intensity of stained membranes.
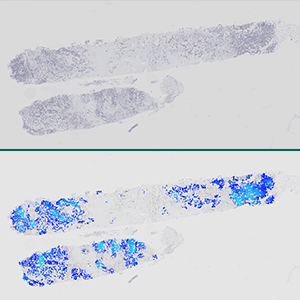
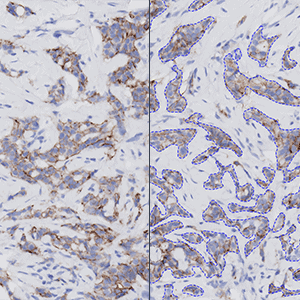
Especially for lower expression cases, it can be challenging to find the areas with positive cells. Let our heat map guide you to those areas of interest and be sure to not miss anything.
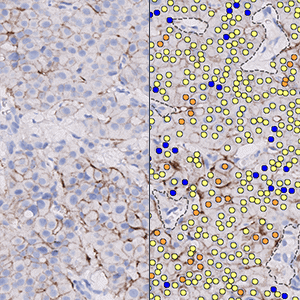
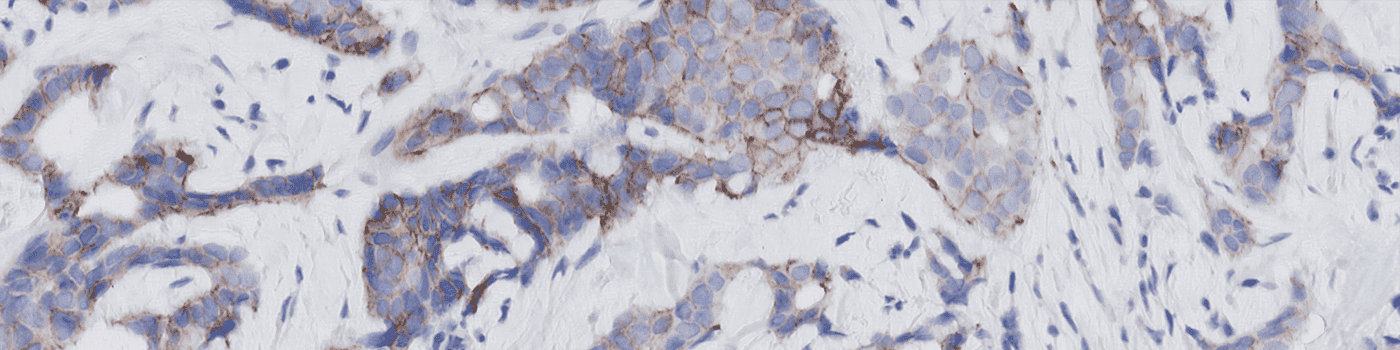
Example case
HER2 Score: 1+
(Manual 2+, FISH negative)
Total tumor cells: 58,200
Negative cells : 29.4 %
1+ cells : 66.3 %
2+ cells : 4.2 %
3+ cells : 0,03%
Quantitative Output variables
The standard output variables are:
HER2 Score (according to ASCO/CAP guidelines)
Negative cells [%]
1+ cells [%]
2+ cells [%]
3+ cells [%]
Total tumor cells [#]
References
1) Wolff A.C. et al.; Human Epidermal Growth Factor Receptor 2 Testing in Breast Cancer: American Society of Clinical Oncology–College of American Pathologists Guideline Update. Arch Pathol Lab Med 2023; 147 (9): 993–1000.
Paper
2) Modi, S. et al., Trastuzumab Deruxtecan in Previously Treated HER2-Low Advanced Breast Cancer. The New England journal of medicine 2022, 387(1), 9–20.
Paper
3) Curigliano G. et al.,Trastuzumab deruxtecan (T-DXd) vs physician’s choice of chemotherapy (TPC) in patients (pts) with hormone receptor-positive (HR+), human epidermal growth factor receptor 2 (HER2)-low or HER2-ultralow metastatic breast cancer (mBC) with prior endocrine therapy (ET): Primary results from DESTINY-Breast06 (DB-06). JCO 42, LBA1000-LBA1000(2024)
Paper
4) Rakha, E. A. et al., UK recommendations for HER2 assessment in breast cancer: an update. Journal of clinical pathology 2023, 76(4), 217–227.
Paper