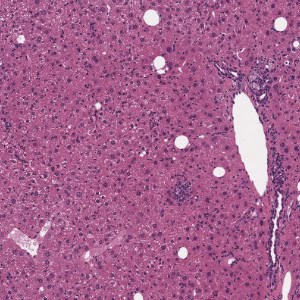
H&E stained liver tissue before portal triad and central vein detection.
#10154
DEVELOPED TO SUPPORT THE NAFLD ACTIVITY SCORE (NAS) FOR NAFLD AND NASH IN RODENTS
In the development of medical knowledge within non-alcoholic fatty liver disease (NAFLD) and the more progressive form non-alcoholic steatohepatitis (NASH), it has been identified that biopsy evaluation is important for NAFLD treatment [1]. The condition is confirmed using the histopathological NAFLD Activity Score (NAS), which grades the severity of steatosis, hepatocellular ballooning degeneration, and inflammation. In addition, fibrosis is evaluated using a separate validated staging system. However, histopathological disease scoring systems are subjective and prone to inter- and intra-observer variation [2]. This Animal Research APP uses a deep learning-based strategy to obtain an accurate and objective method for staging NAS in mouse models of NAFLD and NASH
This APP implements the H&E part of the Kleiner scoring system [3] adapted for mouse models [4].
The work of this APP has been published as an abstract and as a poster on 17th European Congress of Toxicologic Pathology (ESTP 2019) and at the American Association for the Study of Liver Diseases 2019 (AASLD) [5].
For research use only. Not for use in diagnostic procedures.
H&E stained liver tissue before portal triad and central vein detection.
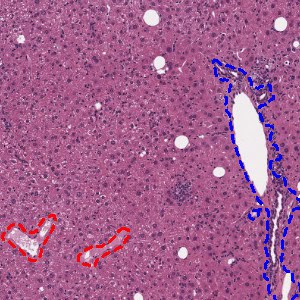
H&E stained liver tissue after portal triad and central vein detection.
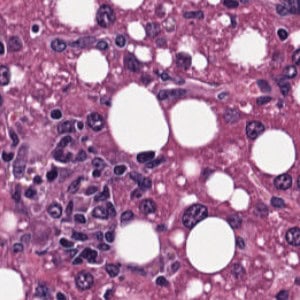
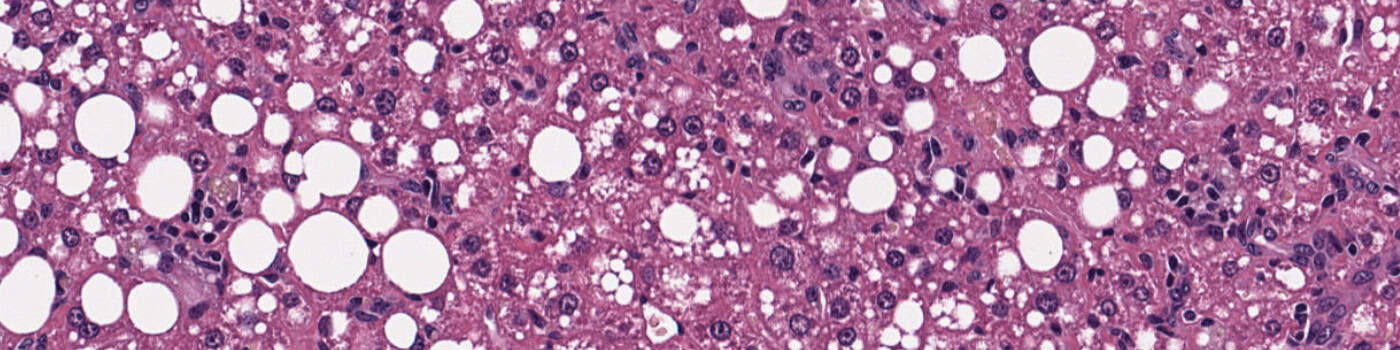
H&E stained liver tissue before nuclei segmentation and foci detection.
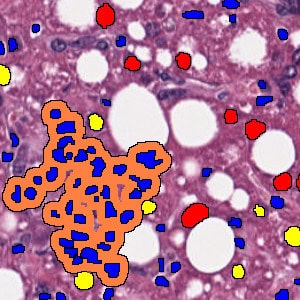
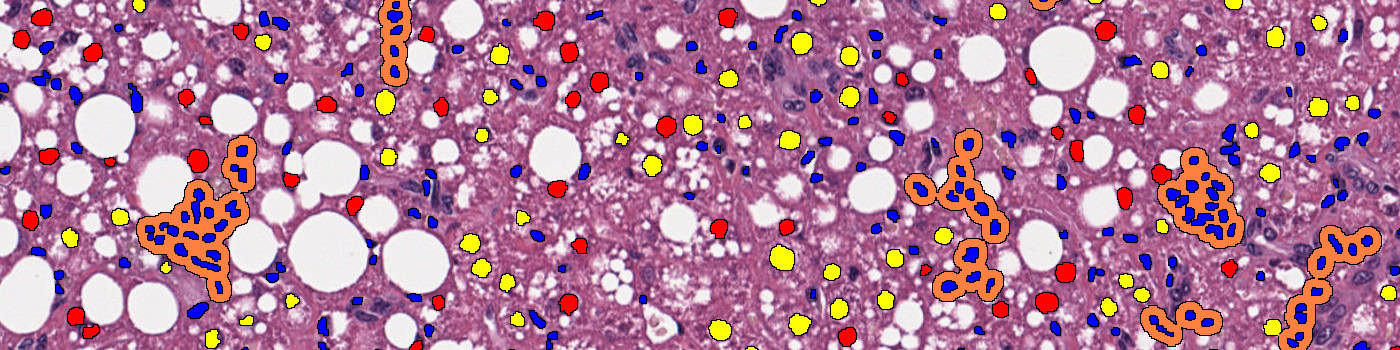
H&E stained liver tissue after nuclei and foci detection.
Hepatocytes with lipids are shown in red.
Hepatocytes without lipids are shown in yellow.
Inflammation nuclei are shown in blue.
Inflammatory foci are shown in orange.
Quantitative Output variables
The output variables obtained from this protocol are:
• Inflammation score: A score in the interval [0, 1, 2, 3] using the foci density
• Steatosis score: A score in the interval [0, 1, 2, 3] using the percentage of hepatocytes with lipids
• Ballooning score (Experimental): A score in the interval [0, 1] using the ballooning cell density.
Workflow
The APP contains 3 protocols
Step 1: Load an H&E stained liver tissue image
Step 2: Load and run the protocol “01 Tissue Detection” for tissue detection
Step 3: Load and run the protocol “02 Central Vein & Portal Triad Detection” for central vein and portal triad detection
Step 4: Load and run the protocol “03 NAFLD Activity Score” for calculate inflammation score, steatosis score and ballooning score (Experimental).
Methods
The APP contains five protocols:
• “01 Tissue Detection”: Liver tissue is outlined using threshold-based image analysis (IA)
• “02 Central Vein and Portal Triad Detection”: A deep learning network DeepLabv3+ [6] available with AuthorTM AI is used to detect central veins and portal triads.
• “03 NAFLD Activity Scoring”: A deep learning network U-Net [7] available with AuthorTM AI is used to detect inflammation nuclei, hepatocytes with and without lipids (droplets) and potential ballooning cells (experimental). The APP disregards portal inflammation and then quantitatively define foci based on the inflammation nuclei neighborhood. We then use the density of foci to score inflammation and the percentage of hepatocytes with lipids to score steatosis. We also use the density of ballooning cells to score ballooning (should be considered experimental).
Additional information
To run the APP, a NVIDIA GPU with minimum 4 GB RAM is required.
The APP utilizes the Visiopharm Engine™ AI and Viewer software modules, where Engine™ AI offers an execution platform to expand processing capability and speed of image analysis. The Viewer allows a fast review together with several types of image adjustment properties e.g. outlining of regions, annotations and direct measures of distance, curve length, radius, etc.
By adding the Author™ AI module the APP can be customized to fit other purposes. Author™ AI offers a comprehensive and dedicated set of tools for creating new fit-for-purpose analysis APPs, and no programming experience is required.
Keywords
Non-alcoholic Fatty Liver Disease, NAFLD, Non-alcoholic Steatohepatitis, NASH, NAFLD Activity Score, NAS, Deep Learning, AI, H&E, Kleiner Score, Mouse
References
[1] Spengler, E. K. & Loomba, Rohit. Recommendations for diagnosis, referral for liver biopsy, and treatment of nonalcoholic fatty liver disease and nonalcoholic steatohepatitis. Mayo Clinic Proceedongs, 2015, 90 (9), 1233–1246. https://doi.org/10.1016/j.mayocp.2015.06.013
[2] Pournik, O., et al. Inter-observer and intra-observer agreement in pathological evaluation of non-alcoholic fatty liver disease suspected liver biopsies. Hepatitis Monthly, 2014, 14 (1), 3–6. https://doi.org/10.5812/hepatmon.15167.
[3] Kleiner, D. E., et al. Design and validation of a histological scoring system for nonalcoholic fatty liver disease. Hepatology, 2005, 41 (6), 1313–1321. https://aasldpubs.onlinelibrary.wiley.com/doi/full/10.1002/hep.20701
[4] Kristiansen, M. N. B., et al. Obese diet-induced mouse models of nonalcoholic steatohepatitis-tracking disease by liver biopsy. World Journal of Hepatology, 2016, 8 (16), 673.
[5] Overgaard, A., et al. Histopathological scoring of non-alcoholic fatty liver disease using deep learning. Hepathology. 2019, 70 (S1), abstract no.1754. https://aasldpubs.onlinelibrary.wiley.com/doi/10.1002/hep.30941
[6] Chen, L., et al. Encoder-decoder with atrous separable convolution for semantic image segmentation. Proceedings of the European conference on computer vision (ECCV) 2018, 801–181, arXiv:1802.02611