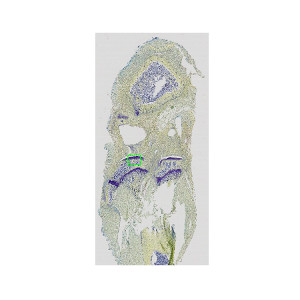
Coronal histological section of guinea pig knee joint, stained with Toluidine blue and Safron. Analysis box placed at tibia cartilage.
#10067
Surgically-induced knee joint instability in rats by transection of the Anterior Cruciate Ligament (ACLT), resection of the medial meniscus (tMx) or a combination of both (ACLT and tMx), is one of the most commonly used experimental animal models of osteoarthritis (OA), see [1] and [2].The model is suitable for studying basic pathophysiological aspects of OA and for the pharmaceutical development of disease-modifying drugs.
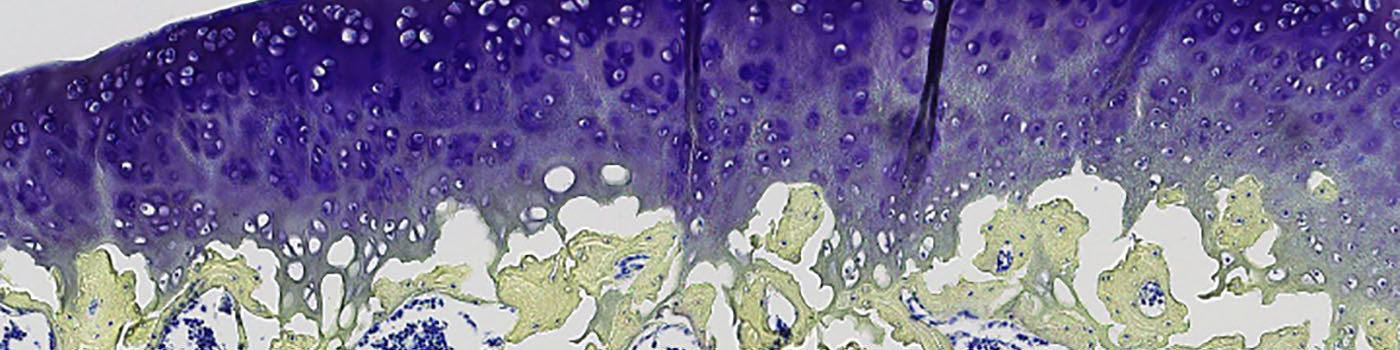
The severity of joint destruction can best be demonstrated in coronal histological sections of the whole knee joint stained with Toluidine Blue -Safron du Gatinais (or with other combinations of staining (see related APPs: 10026, 10027 and 10061). The most important histopathological hallmarks are surface fibrillation and erosion of the articular cartilage, decrease in chondrocyte number, loss of proteoglycan staining and a sclerosis (thickening) of the subchondral bone plate.
Traditionally, the evaluation of the severity of joint damage is done by subjective semi-quantitative grading of the different histopathological features using defined scoring systems, see [3]. However, even with “blinding’ of the observers and sample randomization, this methodology is prone to bias, suffers from low sensitivity to change and requires considerable experience in histopathology. On the other hand, quantitative digital histomorphometry of cartilage destruction and subchondral bone sclerosis can offer an objective, less time consuming and more sensitive assessment of OA histopathology, see [4].
This APP can be used for quantifying a number of parameters relating to joint damage: cartilage surface length, cartilage surface fibrillation, and solid bone percent.
Coronal histological section of guinea pig knee joint, stained with Toluidine blue and Safron. Analysis box placed at tibia cartilage.
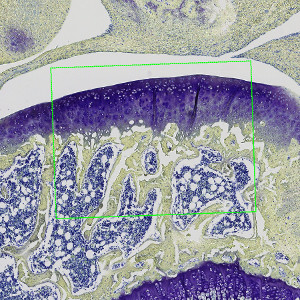
Close-up on tibia cartilage with Analysis box.
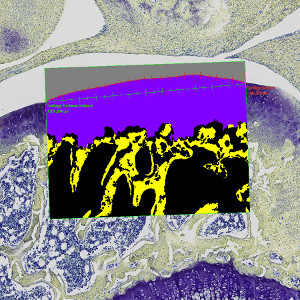
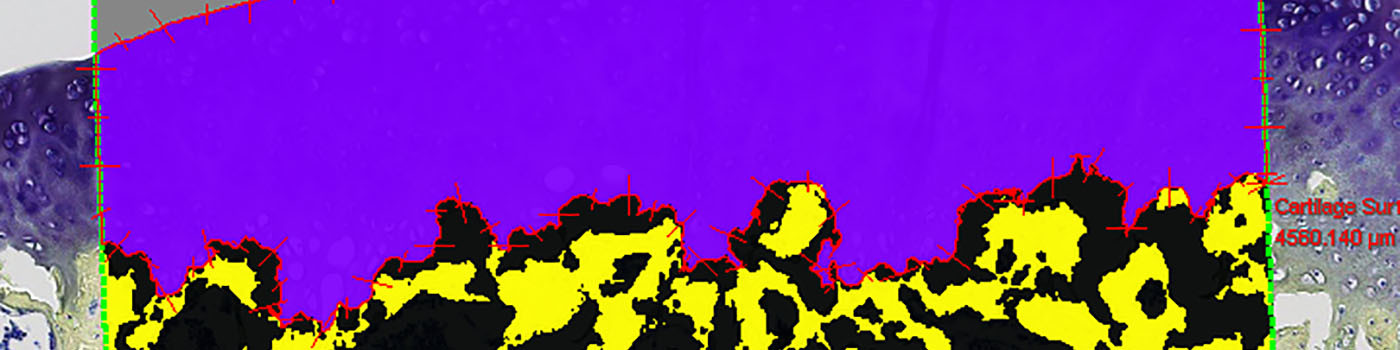
Tissue classified in cartilage, bone, bone lacunae, and joint space. Fibrillation Index measures marked as rulers on cartilage surface.
Auxiliary APPs
Auxiliary APPs are used for additional process steps, e.g. finding Region of Interest (ROI).
This APP takes advantage of prior knowledge about the morphology of the knee joint. To classify and measure correctly there are 4 protocols available.
QUANTIFICATION
01 – QUANTIFICATION – Left
For classification and measurement on cartilage regions on the left side of a joint space.
02 – QUANTIFICATION – Right
For classification and measurement on cartilage regions on the right side of a joint space.
RECALCULATION
Aux 01 – RECALCULATE – Left
For recalculation of quantitative output variables after manual adjustments of tissue classification, on cartilage regions on the left side of a joint space.
Aux 02 – RECALCULATE – Right
For recalculation of quantitative output variables after manual adjustments of tissue classification, on cartilage regions on the right side of a joint space.
Quantitative Output variables
The output variables obtained from this APP include:
Workflow
Step 1: Place an analysis box on a relevant cartilage area with the region drawing tool.
Step 2: Load the APP for tissue component detection and quantification “01 – QUANTIFICATION – Left’ (for cartilage regions on the left side of a joint space in the scanned image) or “02 – QUANTIFICATION – Right’ (for cartilage regions on the right side of a joint space in the scanned image). Click the save button to transfer the results to the database.
The APP can also be executed in a batch process on multiple images at once.
Step 3: If necessary perform a manual review step and adjust tissue classification. Load the APP for recalculation of outputs “Aux 01 – RECALCULATION – Left’ (for cartilage regions on the left side of a joint space in the scanned image) or “Aux 02 – RECALCULATION – Right’ (for cartilage regions on the right side of a joint space in the scanned image). Click the save button to transfer the results to the database.
Methods
This APP can be used on virtual slides, where an Analysis Box with a predefined size is placed manually at a tibia or femur cartilage region, including potential lesion area and excluding osteophytes.
The APP will delineate the residual cartilage, bone, and joint space within the Analysis Box.
On the cartilage surface towards the joint space, the surface length and Euclidean length between measurement points can be obtained for calculation of the Fibrillation Index.
After automatic analysis a review step can be performed, where manual corrections can be made to the tissue classification and a calculation protocol is applied to update the results.
Keywords
Osteoarthritis, Joint, knee, Toluidine blue, Safron du Gatinais, Rat, Cartilage, Fibrillation, Bone sclerosis, quantitative, digital pathology, image analysis.
References
USERS
This APP was developed in corporation with and verified by, Dr. Sven Lindemann and Donata Harazin, Merck KGaA, Germany, Osteoarthritis Research & Early Clinical Development.
LITERATURE
1. Gerwin, N. et. al., Osteoarthritis and Cartilage 2010, 18 (S3), 24-34
2. Hayami, T. et. al., Bone 2006, 38, 234-243
3. Pritzker, K.P. et. al., Osteoarthritis and Cartilage 2006, 14, 13-29
4. Rudolphi, K. et. al., Osteoarthritis and Cartilage in press for OARSI 2012