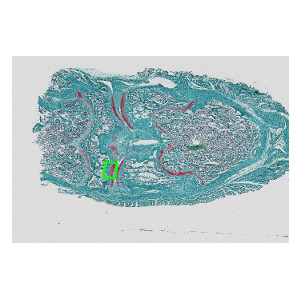
Coronal histological section of guinea pig knee joint, stained with Safranin O and Fast Green. Analysis box placed at the medial tibia cartilage.
#10061
The Dunkin-Hartley guinea pig is a model of spontaneous OA. The development of OA in this model starts already at 3 months of age. When the animals are 6 months old mild to moderate lesions will be present in 90-100% of the animals. Over the next 6 month OA will develop further and the cartilage degenerative changes will be quite profound. The model is suitable for studying basic pathophysiological aspects of OA and for the pharmaceutical development of disease-modifying drugs.
The severity of joint destruction can best be demonstrated in coronal histological sections of the whole knee joint; stained with Safranin-O-Fast Green (see related APP no. 10026 and 10027). The most important histopathological hallmarks are surface fibrillation and erosion of the articular cartilage, decrease in chondrocyte number, loss of proteoglycan staining and a sclerosis (thickening) of the subchondral bone plate.
Traditionally, the evaluation of the severity of joint damage is done by subjective semi-quantitative grading of the different histopathological features using defined scoring systems. However, even with “blinding’ of the observers and sample randomization, this methodology is prone to bias, suffers from low sensitivity to change and requires considerable experience in histopathology. On the other hand, quantitative digital histomorphometry of cartilage destruction and subchondral bone sclerosis can offer an objective, less time consuming and more sensitive assessment of OA histopathology.
This APP can be used for quantifying a number of parameters relating to joint damage: Cartilage volume/area, surface fibrillation and proteoglycan loss (intensity measure). The APP has been verified in treatment studies.
Coronal histological section of guinea pig knee joint, stained with Safranin O and Fast Green. Analysis box placed at the medial tibia cartilage.
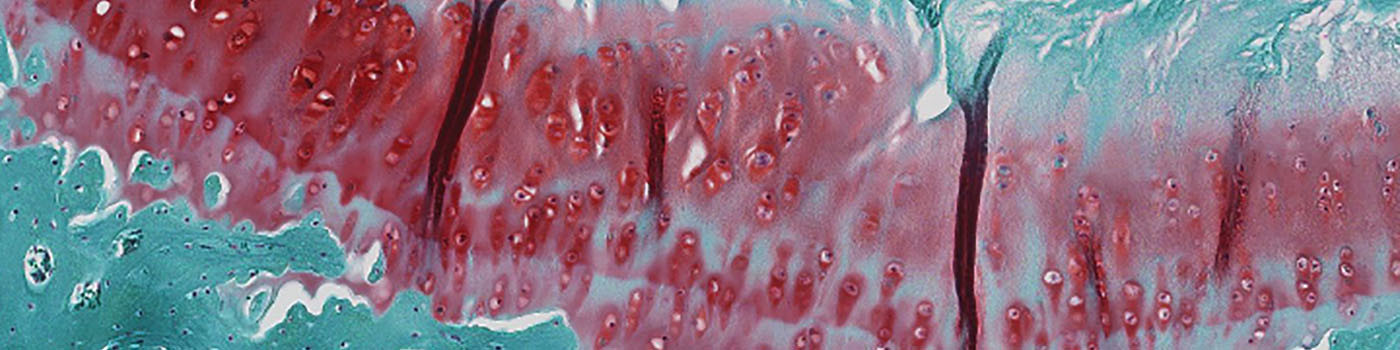
Closeup on medial tibia cartilage with Analysis box.
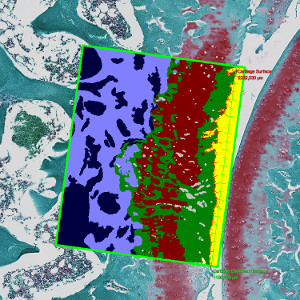
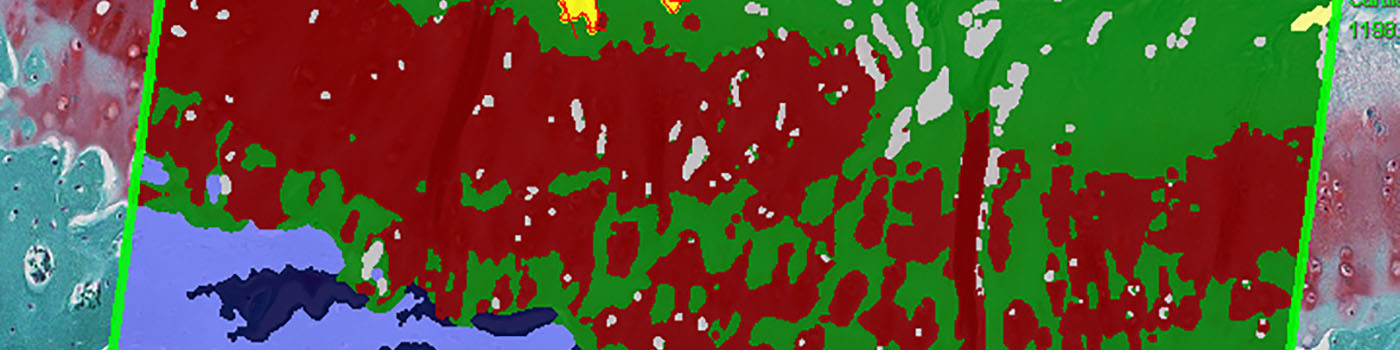
Tissue classified in non-proteoglycan-cartilage, proteoglycan-cartilage, bone, bone lacunae, and joint space. Fibrillation Index measures marked as rulers on cartilage surface.
Auxiliary APPs
Auxiliary APPs are used for additional process steps, e.g. finding Region of Interest (ROI).
This APP takes advantage of prior knowledge about the morphology of the knee joint. To classify and measure correctly there are 4 protocols available.
QUANTIFICATION
01 – QUANTIFICATION – Left
For classification and measurement on cartilage regions on the left side of a joint space.
02 – QUANTIFICATION – Right
For classification and measurement on cartilage regions on the right side of a joint space.
RECALCULATION
Aux 01 – RECALCULATE – Left
For recalculation of quantitative output variables after manual adjustments of tissue classification, on cartilage regions on the left side of a joint space.
Aux 02 – RECALCULATE – Right
For recalculation of quantitative output variables after manual adjustments of tissue classification, on cartilage regions on the right side of a joint space.
Quantitative Output variables
The output variables obtained from this APP include:
Methods
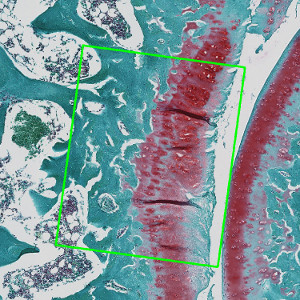
This APP can be used on virtual slides, where an Analysis Box with a predefined size is placed manually at a tibia or femur cartilage region, including potential lesion area and excluding osteophytes.
The APP will delineate the residual cartilage, the proteoglycan-stained cartilage, bone, and joint space within the Analysis Box.
On the cartilage surface towards the joint space, the surface length and Euclidean length between measurement points can be obtained for calculation of the Fibrillation Index.
Due to the often weak differences in staining on bone and cartilage, and the lack of proteoglycan-stained cartilage on some sections, it is necessary to perform a review step. In the review step all images are reviewed and, if necessary, manual corrections can be made to the tissue classification and a calculation protocol is applied to update the results.
Keywords
Osteoarthritis, joint, knee, Safranin-O-Fast Green, Dunkin-Hartley, guinea pig, cartilage, chondrocytes, fibrillation, bone sclerosis, quantitative, digital pathology, image analysis.
References
USERS
This APP was developed in corporation with and verified by, Dr. Sven Lindemann and Donata Harazin, Merck KGaA, Germany, Osteoarthritis Research & Early Clinical Development.
LITERATURE
1. Bendele, A. M., Animal Models of osteoarthritis, J Musculoskel Neuron Interact 2001, 1 (4), 363-376, DOI
2. Pritzker, K.P. et. al., Osteoarthritis cartilage histopathology: grading and staging, Osteoarthritis Cartilage 2006, 14 (1), 13-29, DOI
3. Rudolphi, K. et. al. Osteoarthritis Cartilage in press for OARSI 2012