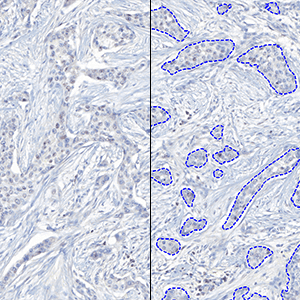
One field of view of the original image at 20X (scaled down to fit this space). ROIs have been outlined manually (green hatched line).
#90002
ER APP, Breast Cancer
In immunohistochemistry (IHC), estrogen receptor (ER) is used to determine prognosis and as a predictive marker for anti-estrogen in breast cancer. The American Society of Clinical Oncology/College of American Pathologists (ASCO/CAP) recommends that the ER status of patients is determined on all invasive breast cancers and breast cancer recurrences [1]. It is, additionally, recommended that the ER status of the tumor is considered positive if there are at least 1 % positive tumor nuclei in a tissue sample.
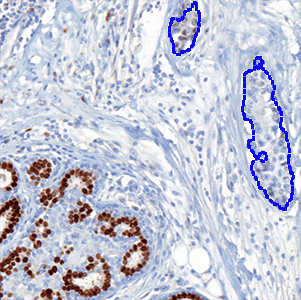
This protocol can be used to determine ER positivity and negativity in a tumor, and provides the number of positive nuclei as well as the total number of nuclei. In addition, the ratio of positive nuclei and the area ratio of positive nuclei are given. Calibration of the protocol allows it to be used on images with different staining intensities. All tumor regions are identified within a region of interest (ROI), which can be outlined manually.
In US: For Research Use Only, not for use in diagnostic procedures.
In EU: CE IVD.
CE-IVD
Details
References
LITERATURE
1. Allison KH, Hammond MEH, Dowsett M, McKernin SE, Carey LA, Fitzgibbons PL, Hayes DF, Lakhani SR, Chavez-MacGregor M, Perlmutter J, Perou CM, Regan MM, Rimm DL, Symmans WF, Torlakovic EE, Varella L, Viale G, Weisberg TF, McShane LM, Wolff AC. Estrogen and Progesterone Receptor Testing in Breast Cancer: ASCO/CAP Guideline Update. J Clin Oncol. 2020 Apr 20;38(12):1346-1366.
2. Unbiased Stereology, C.V. Howard & M.G. Reed, QTP Publications
Quantitative Output variables
The primary outputs of the device are:
Positive Percentage,
which is a value between 0 and 100 and is calculated as
Positive Percentage = (Number of ER positive tumor nuclei)/(Total number of tumor nuclei) × 100
Allred Score,
which is a value between 0 and 8 and is calculated as
Allred Score = Proportion Score + Intensity Score
where Proportion Score is a value between 0 and 5 which reflects the positive percentage, and Intensity Score is a value between 0 and 3 which reflects the intensity of the ER positive nuclei.
The secondary outputs of the device are:
- Neg Nuclei (#), which is the number of tumor nuclei negative for ER
- Pos Nuclei (#), which is the number of tumor nuclei positive for ER
- Total Nuclei (#), which is the total number of tumor nuclei
- Allred Proportion Score
- Allred Intensity Score
Workflow
The APP functions as a standalone (semi-automatic workflow) and in an automatic workflow with the accessory APPs:
#10165 PCK VDS, Tumor Detection for detection of region(s) of interest
#20101 Invasive Tumor Detection (PDS) for detection of region(s) of interest
Methods
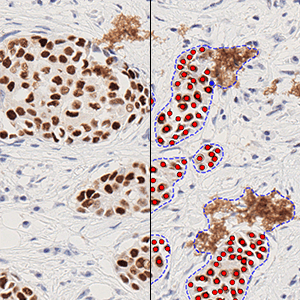
The first image processing step involves a segmentation of all nuclei in the ROI. This is done by using a HDAB-DAB color deconvolution band to detect positively stained nuclei and a multiplication of the red and blue color band to detect negative nuclei. A method for nuclei separation which is based on shape, size and nuclei probability is used, employing a fully automated watershed-based nuclei segmentation technique. Then the positive nuclei are subdivided into three categories based on staining intensities. As a post-processing step, nuclei areas that are too small are removed. The image obtained after post-processing [See FIGURE 3] is used to determine the output variables.
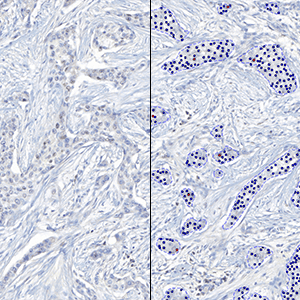
Note on counting: Analyzing full virtual slides usually takes place in a tile-by-tile fashion. If not handled appropriately, nuclei that are intersecting with neighboring tile boundaries would be counted twice (or more). By using unbiased counting frames [2], this can be avoided [See FIGURE 2]. This principle is implemented in this APP.
Staining Protocol
Staining protocols have been developed by the NordiQC and are available from their website. It is also possible to use the links below:
Keywords
Cancer, Breast cancer, Estrogen receptor, ER, Digital pathology, Image analysis, IHC