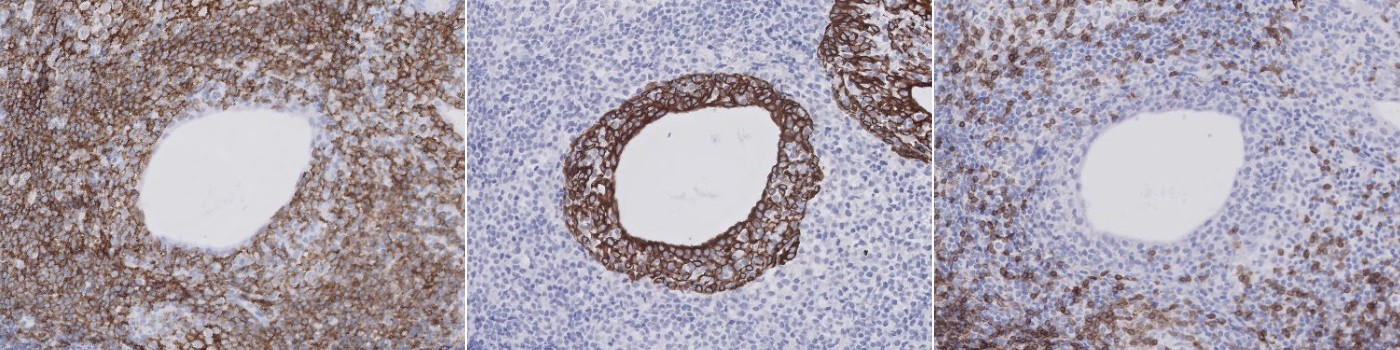
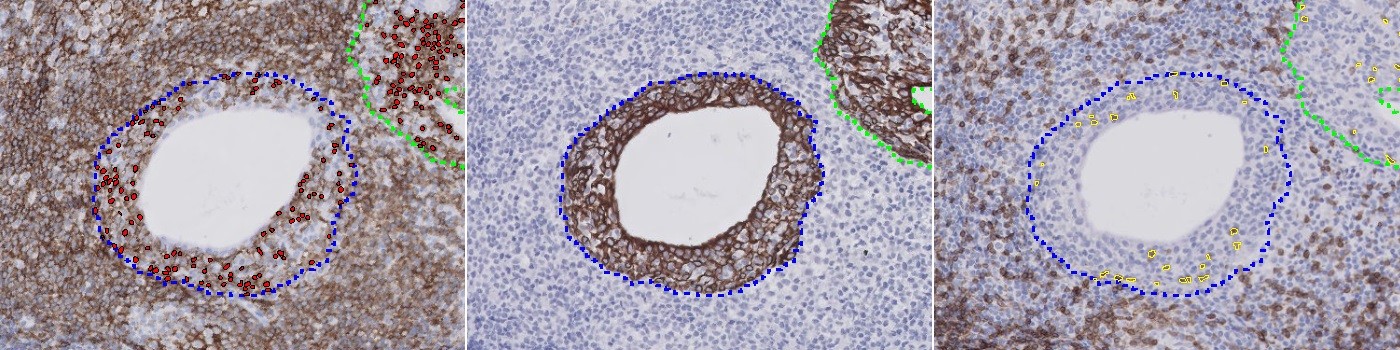
Alignment of 3 serial tissue section images with different stains (CD3, CK, CD20) referred to as Virtual Triple Staining (VTS).
#10128
Sjögren’s syndrome is an autoimmune disease characterized by infiltration of lymphocytes in the striated ducts of salivary gland tissue. The most common symptoms of the syndrome are dry mouth and dry eyes resulting from decreased production of saliva and tears.
Evaluation of the lymphocytic infiltration is relevant in the study of the pathogenesis and outcome of Sjögren’s syndrome, see [1] and [2]. A manual evaluation of the infiltration is challenging, especially if it should be limited to the striated ducts of salivary gland tissue. This APP allows for automatic quantification of CD3 positive T-cells and CD20 positive B-cells within CK positive ducts.
Alignment of 3 serial tissue section images with different stains (CD3, CK, CD20) referred to as Virtual Triple Staining (VTS).
Alignment of 3 serial tissue section images with different stains (CD3, CK, CD20) referred to as Virtual Triple Staining (VTS).
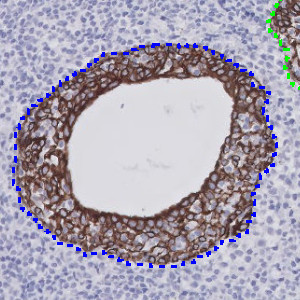
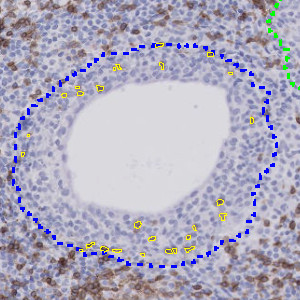
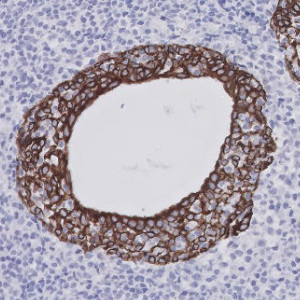
Region of interest in the form of a salivary duct identified based on the CK staining.
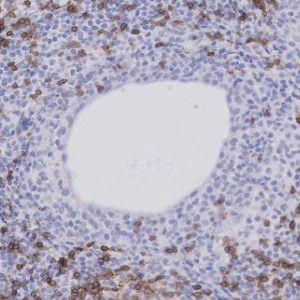
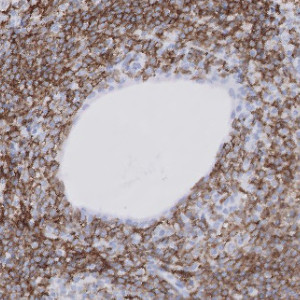
CD3 stained salivary gland tissue.
Auxiliary APPs
An auxiliary APP “01 Tissue Detection” is included for automatic detection of the tissue in the slide.
Quantitative Output variables
The output variables obtained from this protocol are:
Workflow
Step 1: Use the TissueAlign™ module on a set of images in the order CD3, CK, CD20. Save the data.
Step 2: Run the “01 Tissue Detection” auxiliary APP.
Step 3: Run the “02 Duct Detection” APP which detects the salivary ducts.
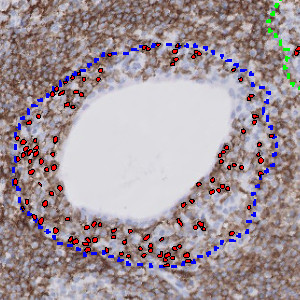
Step 4: Run the “03 CD3 Quantification” APP which detects CD3 positive cells.
Step 5: Run the “04 CD20 Quantification” APP which detects CD20 positive cells.
Methods
The APP is based on a virtual triple staining (VTS) technique where serial tissue sections with different stains are co-registered and analyzed as a single slide for quantification. The co-registration is referred to as alignment and is carried out using the Tissuealign™ module. The order of alignment is: CD3 section followed by CK section followed by CD20 section.
The ducts are found by use of the HDAB-DAB color deconvolution band and an intensity-based threshold classifier. The configuration for quantification of CD3 positive cells works within the automatically outlined ducts. Detection of CD3 positivity is based on the HDAB-DAB color deconvolution band and separation of positive cells are based on application of a watershed algorithm assisted by a polynomial local linear filter applied to the red color band. The CD20 positive cells are detected by characterization of the stain in the cytoplasm of the cells based on the HDAB-DAB color deconvolution band. A polynomial blob filter and a polynomial local linear filter similar to that used for the CD3 cell quantification protocol assists the cytoplasm detection.
Staining Protocol
There is no staining protocol available.
Keywords
Sjögren’s syndrome, CD3, CD20, IHC, Virtual multiplexing, Digital pathology, Image analysis
References
USERS
This APP was developed for Dr. Bert Van Der Vegt, University Medical Center Groningen, Netherlands.
LITERATURE
1. Cornec, D. et. al. B cells in Sjögren’s syndrome: from pathophysiology to diagnosis and treatment, J. Autoimmun. 2012, 39 (3), 161-167, DOI.
2. Singh, N. et. al. The T cell in Sjögren’s syndrome: force majeure, not spectateur, J. Autoimmun. 2012, 39 (3), 229-233, DOI.