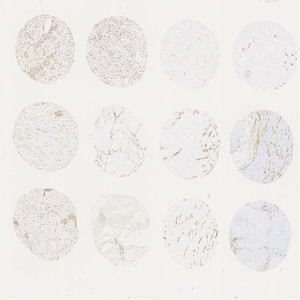
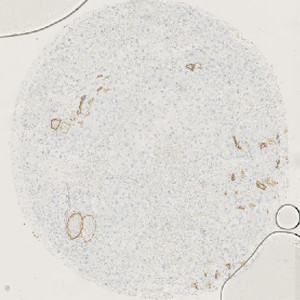
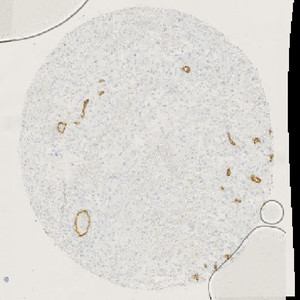
Each TMA slide is stained with either CD31 or CD34.
#10057
Advanced kidney cancer is treated by targeted therapies with antiangiogenic agents. However, not all patients will benefit from this treatment and therefore patients can be divided into two groups: responders and non-responders.
It is of interest to define the differences between these two groups. One of the differences that are examined is the degree of maturity of the microvessels. For this purpose the vessel markers CD31 and CD34 are used. Since CD31 is a marker for mature vessels, CD34 positivity in the absence of CD31 can be used to identify more immature vessels.
The purpose of this APP is to quantify the CD31 positive areas, CD34 positive areas, and overlapping positive areas to investigate if the ratio of mature to immature vessels is one of the differences between the responder and non-responder groups.
From a TMA block, sequential slides were obtained and each slide was stained with either CD31 or CD34 (see FIGURE 1). Using the patented Autodisector technology, the two sequential slides can be overlaid (see FIGURE 2) and each TMA core-pair is automatically aligned at a high magnification, cell-to-cell level, to facilitate the detection of overlapping positive stain between the two slides (see FIGURE 7).
Note: To obtain satisfying results from this technology it is crucial that the sequential slides are taken with as small a distance between them as possible. This technology can be applied to both TMAs and whole tissue sections. When used with TMAs or other small tissue sections, tissue folds and other artifacts must be kept at an absolute minimum to obtain good alignment results.
Each TMA slide is stained with either CD31 or CD34.
Using the Tissuealign module, the sequential core pair is overlaid. Here they are shown with a 50 % transparency to illustrate the initial misalignment.
In the next step the two tissue cores are automatically aligned, as shown here with a 50% transparency (as in the previous example). Notice the curved edge of the top layer which illustrates that it has been stretched/deformed to get the best possible match between the two layers.
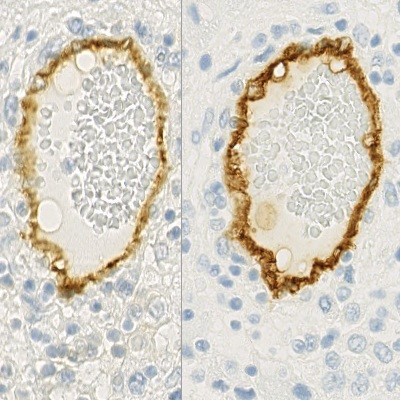
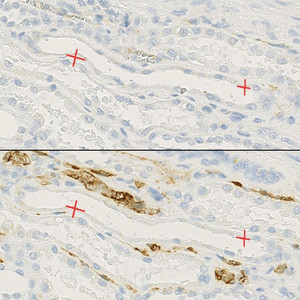
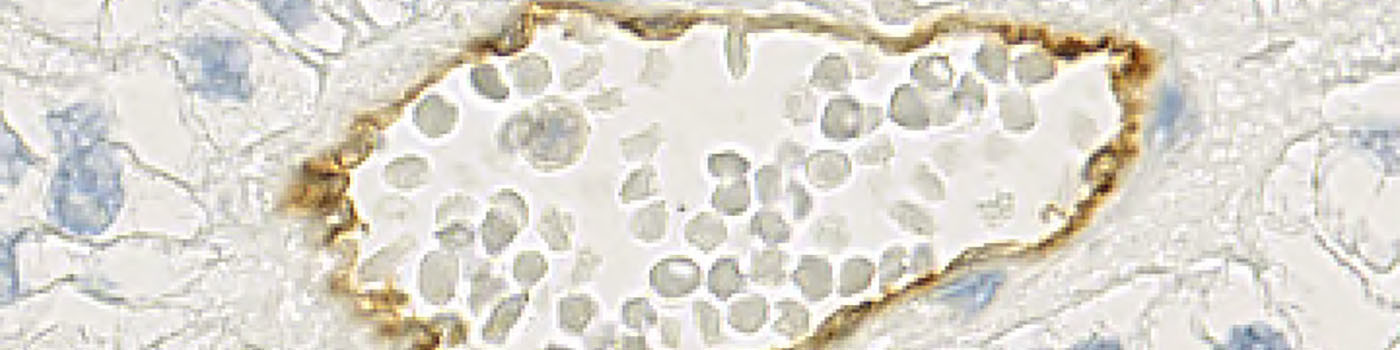
High magnification (20X) view of the same vessel stained with CD31 (left) and CD34 (right).
Auxiliary APPs
Auxiliary APPs are used for additional process steps, e.g. finding Region of Interest (ROI).
ALIGNMENT
This auxiliary APP is used to for the semi-automatic alignment of tissue pairs and must be launched from the Sectionassembler (Tissuealign) module. The alignment APP includes settings for TMA tissue detection, auto alignment parameters, detection of tissue before sampling and sample settings so that the user does not have to decide on any settings, but only has to go through the workflow.
Alignment of serial sections:
Step 1: Load the Auxiliary APP in the Sectionassembler (Tissuealign) module.
Step 2: Import virtual slides and follow the workflow steps in the module:
a. Detect tissue and manually correct if necessary
b. Link cores. Skip cores that are too damaged (excess amount of tissue folds, holes, or similar) or where it is obvious that there is not a good correlation between the two sections, e.g. if one tissue core has been severely stretched or otherwise deformed.
c. Align sections – press the Align All button.
d. Detect sampling area (can be skipped). Used to refine the outline that was made in a).
e. Sample. Press the ‘Sample in All’ button. Cores are extracted and aligned at high magnification.
f. Review the high magnification alignment.
g. Adjust the high magnification alignment if required, otherwise close the Tissuealign module and go to the Image Analysis module.
Quantitative Output variables
Workflow
Quantification of mature to immature vessel ratio:
Step 1: Load the APP
Step 2: The ROI from the alignment was saved with the extracted cores. Manually exclude areas of artifacts.
Step 3: Run the APP in batch mode or on single images.
Methods
The images that are obtained from the alignment procedure are two-layered TIFF files. In each image, the first layer is the CD31 stained core and the second layer is the CD34 stained core. The layers are referred to as frame 1 and frame 2 in the software.
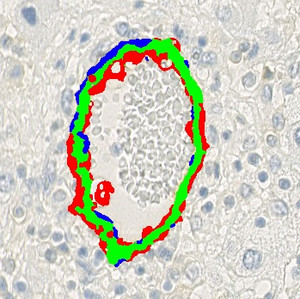
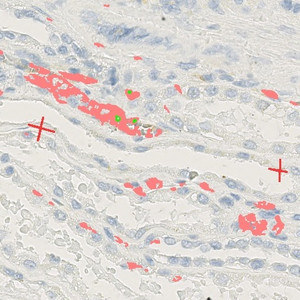
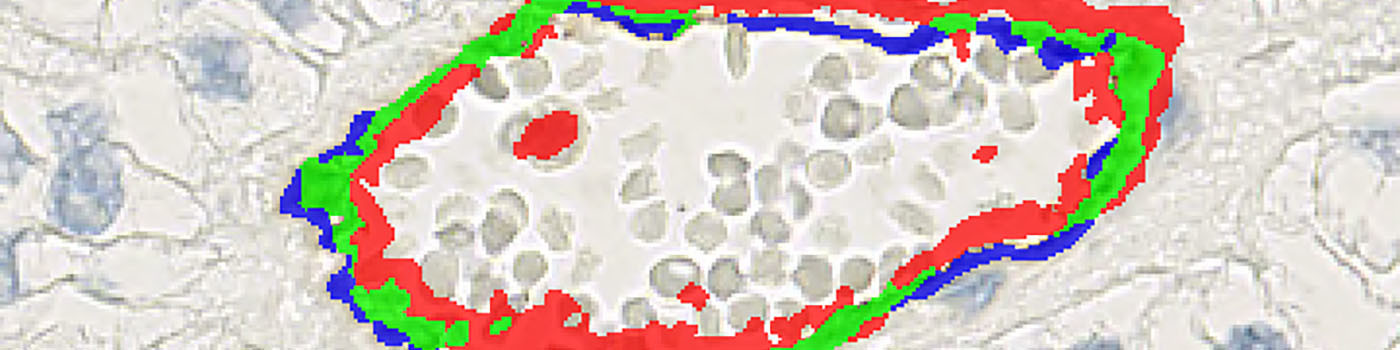
Based on a DAB color deconvolution, (see FIGURE 5), the positive stain areas are identified as areas where the stain density is higher than a certain threshold. This leads to a segmentation of the image using three labels:
Overlap Pos Stain: Areas where the stain density is high enough for both CD31 and CD34.
CD31 Positive: Areas where only CD31 positivity is present.
CD34 Positive: Areas where only CD34 positivity is present.
These three categories are labeled in green, blue, and red respectively, (see FIGURE 6).
If there are artifacts on the slides, such as black spots or shadows these must be manually removed from the ROI to ensure that they are not included as positive stain.
Staining Protocol
There is no staining protocol available.
Keywords
CD31, CD34, Kidney Cancer, responders, non-responders, vessel maturity, immunohistochemistry, image analysis
References
USERS
Development of this APP was in collaboration with Dr James Thompson, Karolinska Healthcare Research Biobank (KHRBB) – Karolinska University Hospital, Stockholm, Sweden, and Dr Carina Strell, Cancer Center Karolinska, Dept of Oncology & Pathology, Karolinska Institutet, Stockhom, Sweden.
LITERATURE
There are no references.