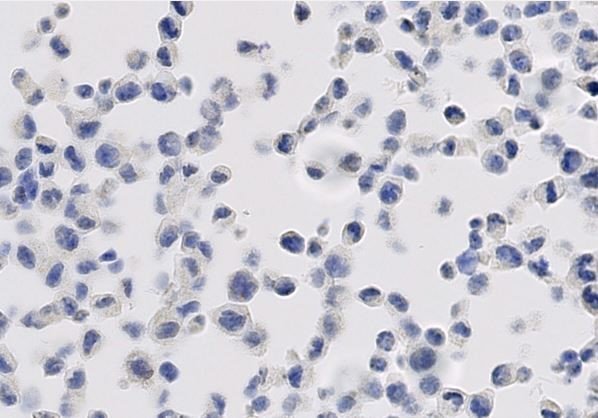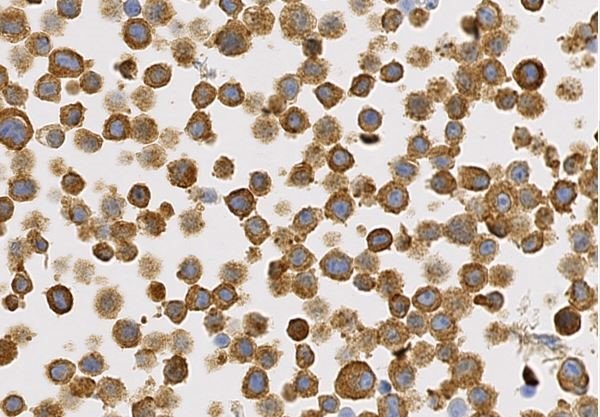
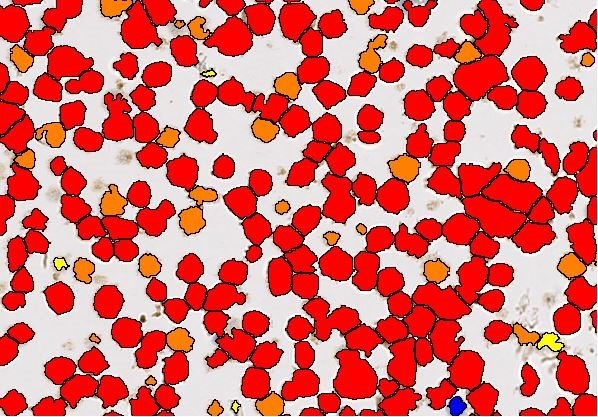
Positive cell line core, with strong cytoplasmic granular staining pattern.
#10079
The availability of genetically defined reference materials, offers an industry standard for development and quality control of IHC assays, directly, thereby improving the accuracy and reproducibility.
IHC HDx™ Reference Standards provide laboratories with a consistent source of positive and negative reference material on one slide.
CELL LINE DETAILS
This reference standard is wild type for codon 600 (V600) of the BRAF gene. The proto-oncogene BRAF encodes for the serine/threonine-protein kinase B-Raf. A number of companion diagnostic (CDx) drugs, including Vemurafenib, have been developed that target BRAF driven cancers (i.e. late-stage melanoma).
BRAF V600E has a strong cytoplasmic and membrane staining pattern observed in the positive core. No cytoplasmic and membrane staining pattern is observed in the negative core. Stained on the Automated Leica BOND Max stainer (Spring Bioscience, VE1, #E19292).
ANALYSIS DETAILS
The BRAF analysis algorithms for Oncotopix®, supports the analyzer in obtaining accurate, precise quantification of biomarker expression for BRAF protein. The APP can be configured to provide positive ratio or H-Score. Based on the H-score output, it is possible to Identify the negative, intermediate and positively reacting cores.
The combination of IHC HDx™ Cell lines and the Oncotopix with the BRAF APP, provides the basis of a high quality regent QC system.
Positive cell line core, with strong cytoplasmic granular staining pattern.
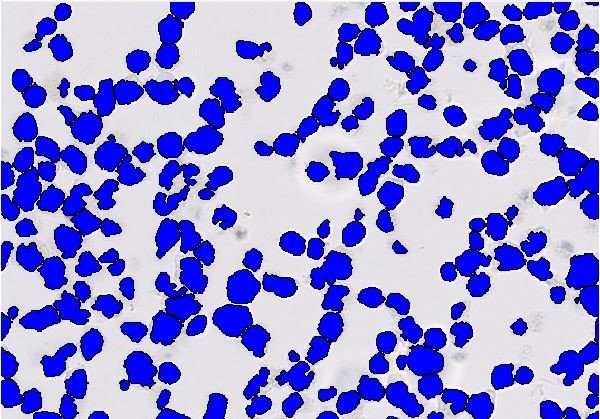
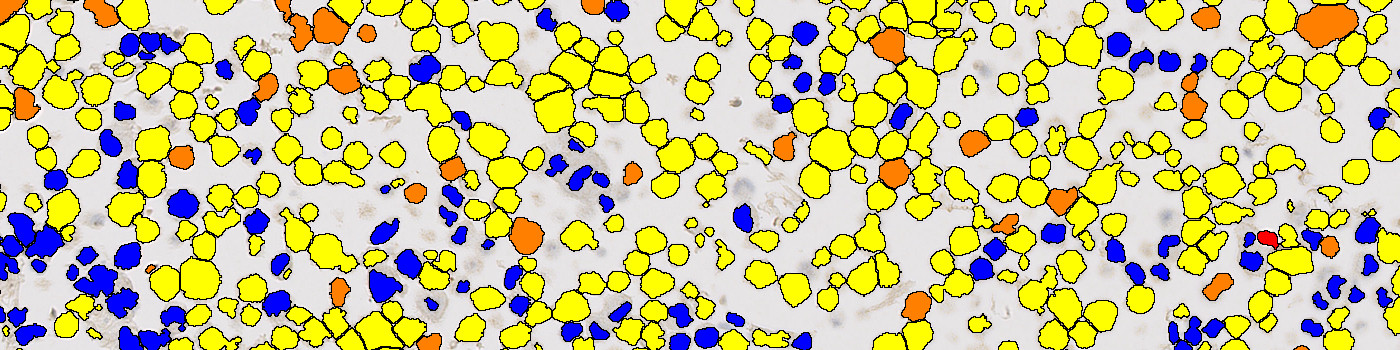
The image from FIGURE 1, analyzed with the BRAF APP. Strong positive nuclei (3+) are labeled red, intermediate (2+) orange, weak (1+) yellow, and negative blue.
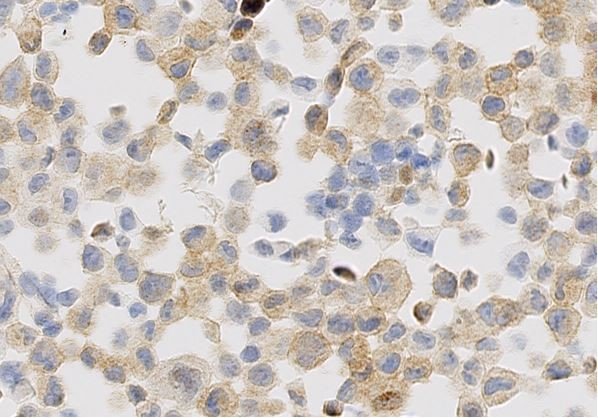
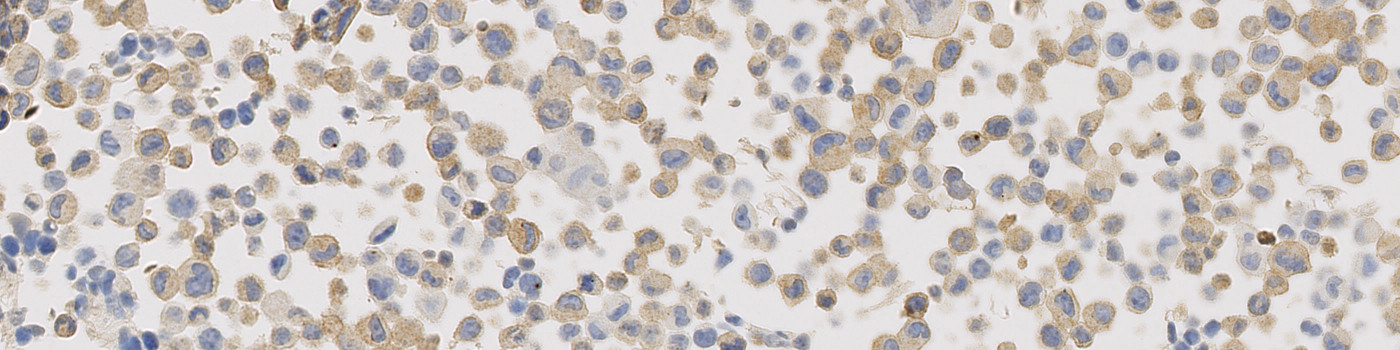
Intermediate cell line core.
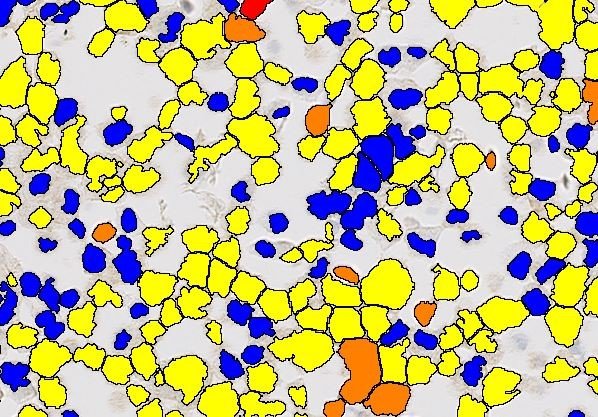
The image from FIGURE 3 analyzed with the BRAF APP. Strong positive nuclei (3+) are labeled red, intermediate (2+) orange, weak (1+) yellow, and negative blue.
Additional information
Defined cores containing positive and negative protein expressing cell lines on the same slide, provides a source of renewable and consistent point of reference when optimizing and monitoring the performance of an IHC assay.
The availability of genetically defined reference materials, offers an industry standard for development and quality control of IHC assays, directly.