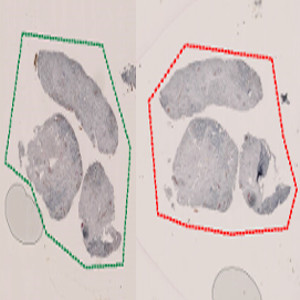
Original image scaled to fit this space. First step involves a manual outline of the tissue samples to be analyzed. The APP treats the green and the red ROIs as two separate objects.
#10055
Studying vessel morphology has gained considerable attention due to the tumor vasculature emerging as an important therapeutic target for cancer.
The “aSMA+Col IV, Breast Cancer” APP facilitates easy identification and quantification of vessel structures in whole slide breast tissue samples stained with aSMA and col IV.
Original image scaled to fit this space. First step involves a manual outline of the tissue samples to be analyzed. The APP treats the green and the red ROIs as two separate objects.
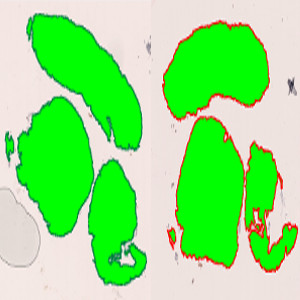
The auxiliary APP “01 ROI Detect” automatically outlines the individual tissue samples based on the initial manual outlines seen in FIGURE 1. Notice that tissue to the left on the slide is represented as a green ROI, while tissue to the right on the slide is represented by a red ROI.
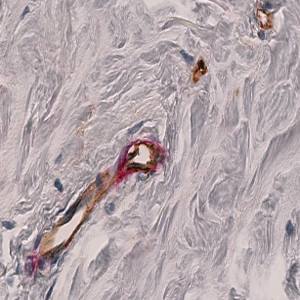
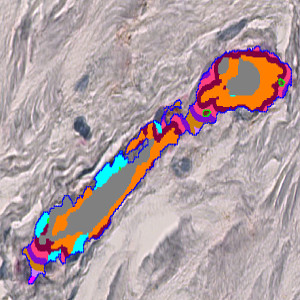
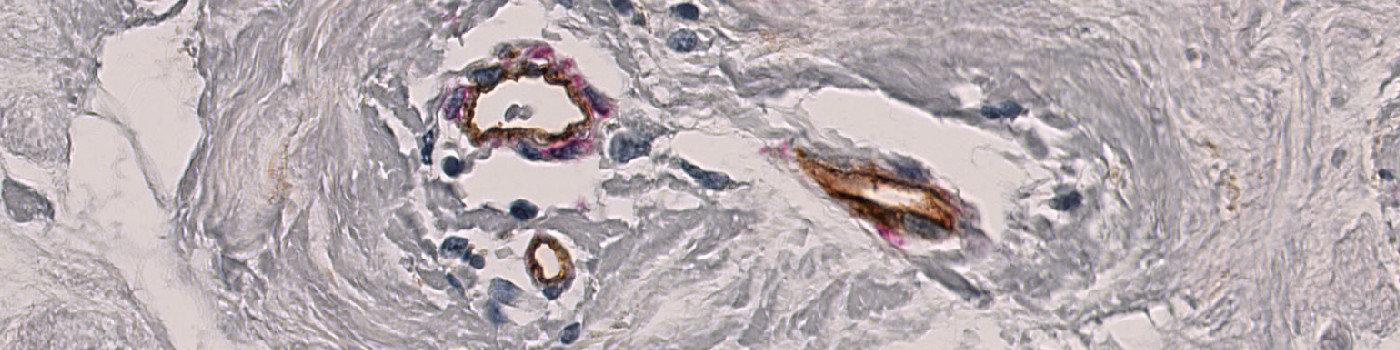
Raw image of two vessel structures.
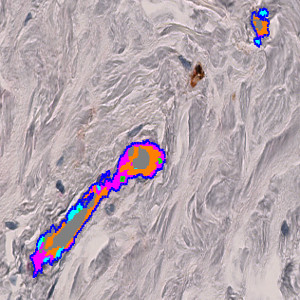
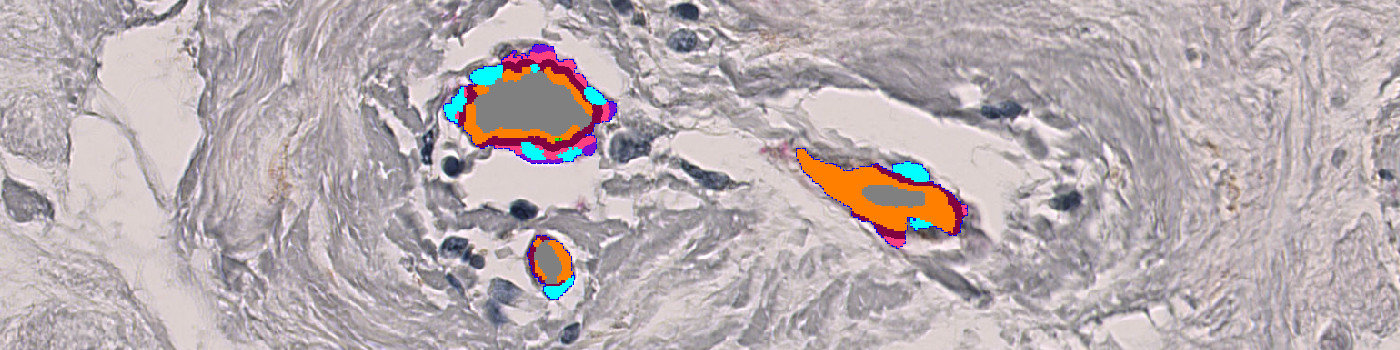
Result of vessel identification with the APP. Two vessel structures have been identified and further split into: Lumen (gray label), Vessel-AEC (i.e. red stained vessel tissue, pink label), Vessel-DAB (i.e. brown stained vessel tissue, orange label) and nuclei (turquoise label).
Auxiliary APPs
ROI DETECTION:
APP: “01 – ROI Detect”
This APP can be used for automatic and precise identification of tissue present on image. The APP uses a rough manual outline as input for precise localization of tissue, and facilities separate analysis of multiple tissue samples present on one image.
Quantitative Output variables
The output variables obtained from this protocol include:
The output variables are individually reported for each of the tissue samples outlined in the first manual interaction step.
Workflow
Step 1: Load and run the auxiliary APP “01 – ROI detect” for precise tissue detection based on rough manual outlines.
Step 2: Load and run the APPs “02 – Vessels ROI 1” and “03 – Vessels ROI 2” for vesel detection.
Step 3: Load and run the quantification protocol “04 – Endpoints”. This APP divides the AEC-stain into several dilation bands and outputs parameters such as “Total Vessel Area” and “Area of Lumen”.
Methods
The color deconvolution bands AEC_DAB-AEC and FastRed_DAB-DAB are used for isolating the aSMA and col IV stained vessel tissue on the slide. A HDAB-Haematoxylin color deconvolution band is used for identifying and excluding the stromal nuclei so that they do not contribute to the vessel structures. All color deconvolution bands have been smoothed with a median filter to reduce high-frequency noise. Feeding these feature images to a linear Bayesian classifier enables the identification of vessel structures and stromal nuclei. This initial vessel identification is then further refined by use of morphological and contextual post-processing steps. As a final step the red vessel structures are subdivided into 5 different dilation bands.
Staining Protocol
There is no staining protocol available.
Keywords
Vessel morphology, breast cancer, aSMA, ColIV, image analysis, IHC
References
LITERATURE
There are currently no references.