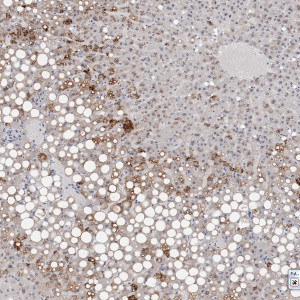
Adipophilin stained tissue from a primate liver.
#10023
Fatty liver disease (FLD) is a disease that is normally associated with alcoholism or obesity in humans. This reversible condition is an abnormal retention of fat within the hepatocytes and results in an accumulation of large triglyceride fat vacuoles in the liver. Defects of the fat metabolism are responsible for the pathogenesis of fatty liver. Therefore, metabolic diseases that affect the normal metabolism of fat can also cause fatty liver disease. At the early stages, the fatty changes will be microvesicular, meaning that multiple fat droplets will fill the liver cells, without dislodging the nucleus. In later stages the changes become macrovesicular as the nucleus is forced to the periphery of the vacuole. These vacuoles are represented as sharply demarcated empty spherical spaces within the cytoplasm of hepatocytes. The fatty change becomes irreversible when the vacuoles combine and form fatty cyst lesions.
Quantification of fat vacuoles in a fatty liver is relevant in many applications. In toxicological pathology, the two main areas of interest are common toxicological change and prognosis of alcoholic liver disease. In drug development, a fatty liver will be an indicator of a toxic effect on metabolism in toxicology screenings. By extracting information about both number and area distribution of the fat vacuoles, the toxic effect of the drug (or efficacy if it is a treatment study) can be quantified and the stage of the fatty liver disease can be determined.
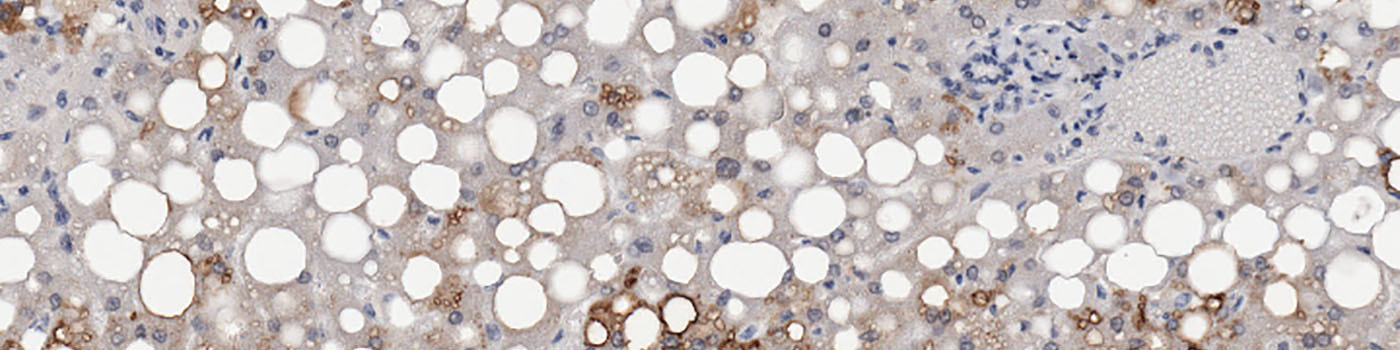
Adipophilin stained tissue from a primate liver.
Segmentation before final post processing.
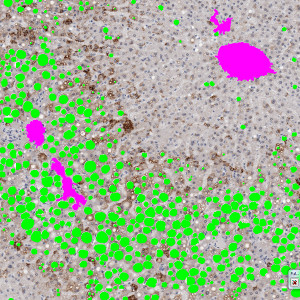
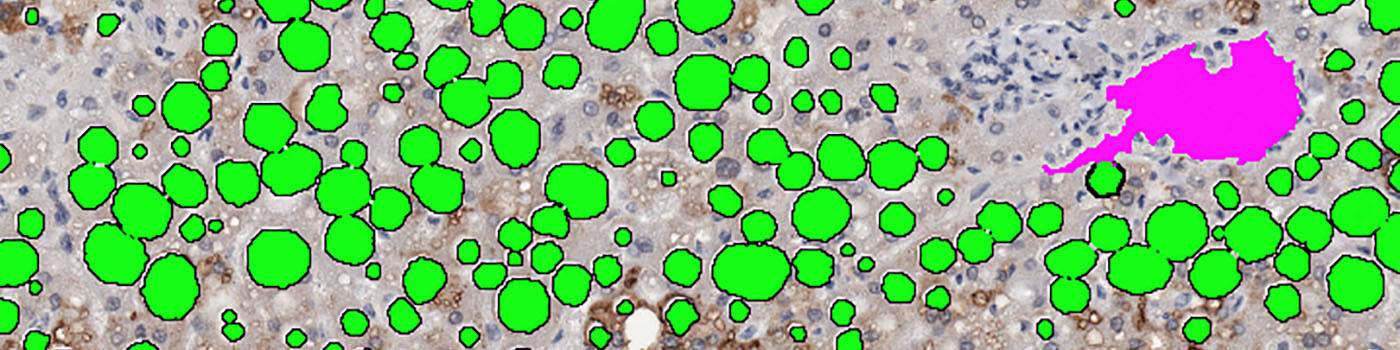
Segmentation after post processing. Fat vacuoles (green label), and discarded vacuoles within vessels or hepatic sinusoids (pink label) are identified.
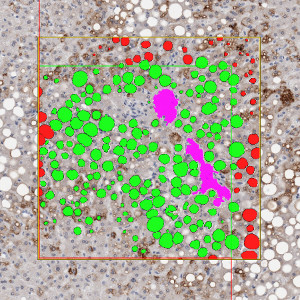
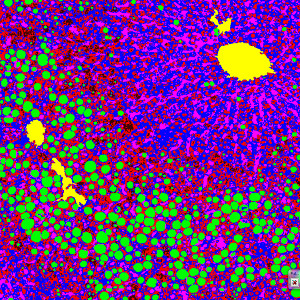
Using un-biased counting frames in the detection of fat vacuoles ensures that each object is counted only once.
Auxiliary APPs
Auxiliary APPs are used for additional process steps, e.g. finding Region of Interest (ROI).
ROI
The auxiliary APP ’01 ROI’ can be used to automatically detect a ROI. The ROI is generated by distinguishing tissue from background.
Quantitative Output variables
The output variables obtained from this protocol include:
Methods
The fat vacuoles are already well segregated in the original image. However, there are other vacuolar spaces that could be perceived as fat vacuoles that are not lying inside the hepatocytes. Furthermore, many fat vacuoles lie close together. To get the correct number and areas, these must be counted separately. When applying a mean filter to the IHS-I image to smooth out image irregularities, the fat vacuoles stand out as clear spaces. By doing this, any random variations in the image are removed, thus creating a less noisy initial classification and reducing the need for post processing steps (see FIGURE 1).
The classifier used in this application is a Bayesian classifier, trained to detect hepatocyte area, fat vacuoles, sinusoids and blood vessels (see FIGURE 2). This is followed by post processing steps that ensure a separation of all fat vacuoles and include fat vacuoles only within hepatocytes i.e. any objects that are initially classified as fat, but discarded if they are within vessels or hepatic sinusoids (see FIGURE 3).
LITERATURE NOTE ON COUNTING
Analysis of full virtual slides takes place in a tile-by-tile fashion. If not handled appropriately, fat vacuoles that are intersecting with neighboring tile boundaries would be counted twice (or more). Using unbiased counting frames, see [1], this can be avoided (see FIGURE 4). This principle is implemented in the present APP. Depending on fat vacuole size and density, the application of this principle could make an important difference.
Keywords
Fatty liver disease, toxicological changes, alcoholic liver, obesity, metabolism, quantitative, digital pathology, image analysis.
References