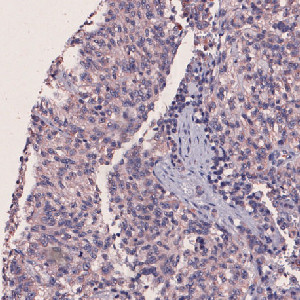
Nuclei surrounded by m-PGES1 negative and weakly positive staining.
#10132
Microsomal prostaglandin E synthase-1 (mPGES1) (genetic determinant of early onset breast cancer and predisposition to cancers of the ovary, colon, prostate gland and Fallopian tubes) is the downstream enzyme in the prostaglandin pathway. Expression of mPGES1 is inducible in conditions of inflammation and hypoxia and its expression is regulated by a number of transcriptional factors. Clinical studies have shown increased levels of mPGES-1, associated with increased PGE2 production, within a number of human cancers, including colon, lung, stomach, pancreas, cervix, prostate, papillary thyroid carcinoma, head and neck squamous carcinoma, brain tumors and melanoma.
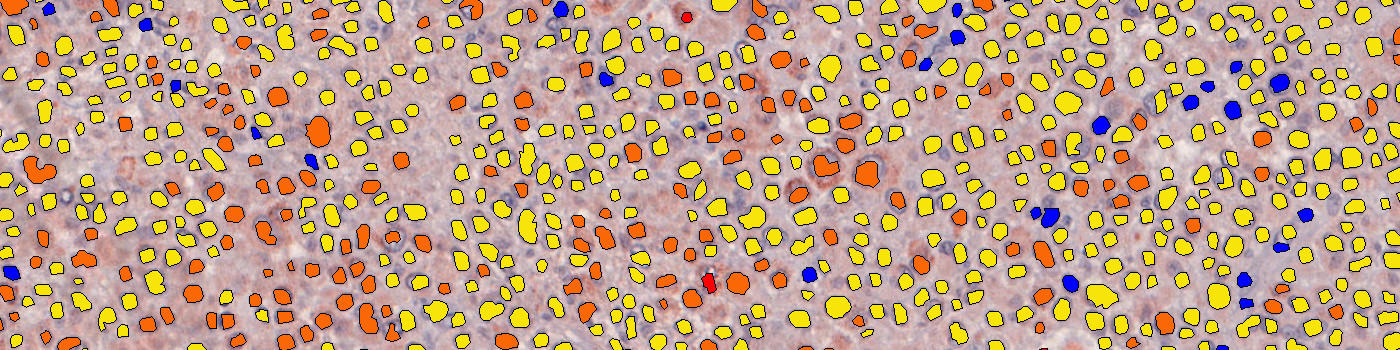
The “10132 – m-PGES1, Melanoma, TME” APP detects nuclei and classifies them as either negative, 1+, 2+ or 3+ based on the m-PGES1 staining expression present in each nucleus’ vicinity.
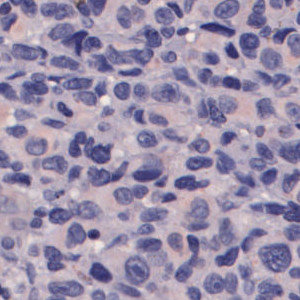
Nuclei surrounded by m-PGES1 negative and weakly positive staining.
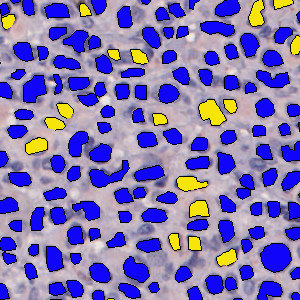
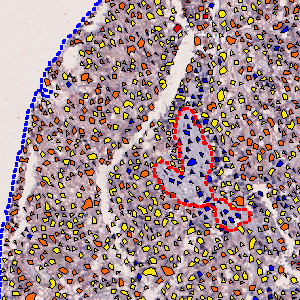
Nuclei classified as negative (blue) or 1+ (yellow) based on the m-PGES1 staining of each nucleus’ surroundings.
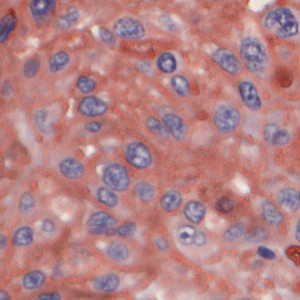
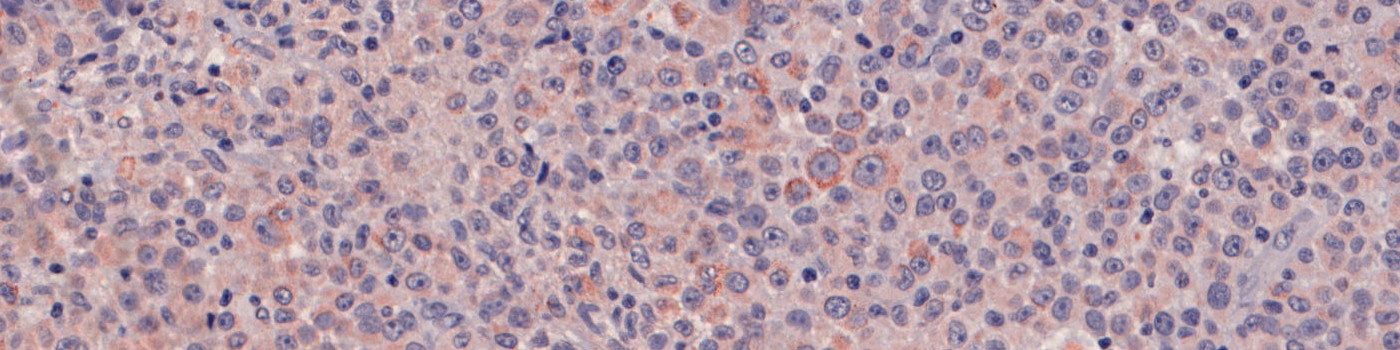
Nuclei surrounded by m-PGES1 intermediate and strongly positive staining.
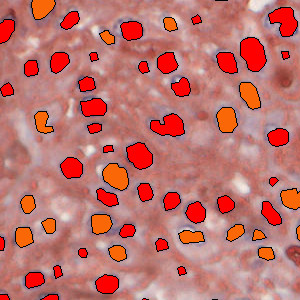
Nuclei classified as 2+ (orange) or 3+ (red) based on the MIF staining of each nucleus’ surroundings.
Auxiliary APPs
APP: “01 Detect TumorStroma”
The auxiliary APP: “01 Detect TumorStroma” is used for automatic tumor and stromal tissue detection. The analysis APP will then provide results for tumor and stromal tissue separately.
Quantitative Output variables
The output variables obtained from this protocol include:
Workflow
Step 1: Load and run the APP “01 Detect TumorStroma” for tumor and stromal tissue identification. Maually correct the result if necessary.
Step 2: Load and run the APP “02 m-PGES1 Analysis” for the quantification of cells.
Methods
To identify the nuclei, the APP performs a two-stage polynomial blob filtering on a blue-enhanced feature image and delimits them using local linear filtering. Each pixel with DAB staining is classified as low, mid and high based on the intensity and grouped together locally. Each nucleus is then classified based on its surroundings in the order of 3+, 2+, 1+ and negative to emphasize the strongest staining present in each nucleus’ vicinity.
Staining Protocol
There is no staining protocol available.
Keywords
m-PGES1, microsomal prostaglandin E synthase-1, melanoma, skin, cancer, oncology, IHC, tumor micro environment
References
LITERATURE
There are currently no references.