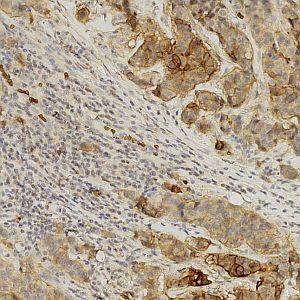
Field of view showing a tumor region in an image of a breast tissue section analyzed by IHC for GLUT1.
#10009
The Glucose transporter 1 (GLUT1) is a protein in humans encoded by the SLC2A1 gene. GLUT1 facilitates the transport of glucose across the plasma membranes of mammalian cells. GLUT1 is responsible for the low-level of basal glucose uptake required to sustain respiration in all cells. A high expression of GLUT1 immunoreactivity in cancer (esophagus, stomach, colon, lung and breast) has been associated with aggressive behavior and shorter survival.
This APP can be used for quantification of GLUT1 membrane immunoreactivity. The parameters used in the APP allow measurement of the expression of sodium/proton exchangers at the plasma membrane in tissue sections. As the function of sodium/proton exchangers relates to their localization, quantitative assessment of localized expression will presumably correlate with function. Comparison of matched sets of samples (e.g. tumors versus normal) allows correlation of expression as a function of (disease) status.
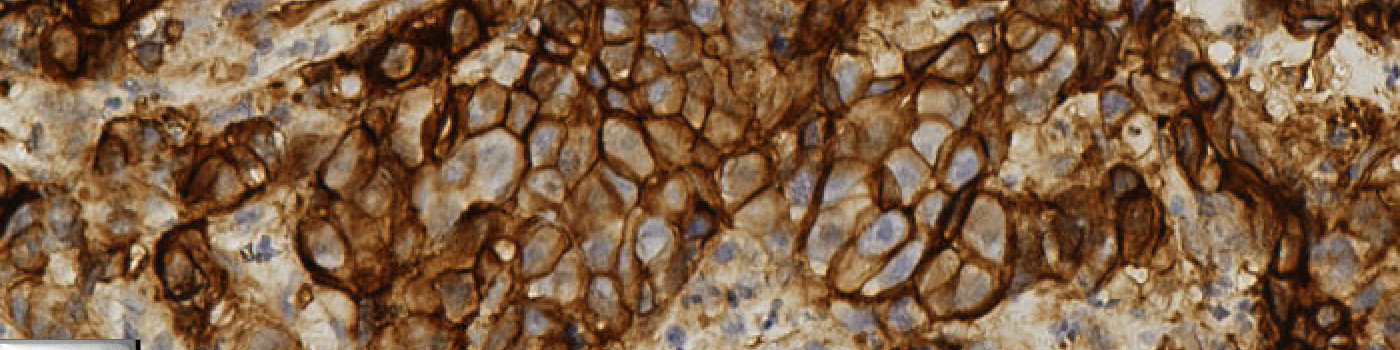
Field of view showing a tumor region in an image of a breast tissue section analyzed by IHC for GLUT1.
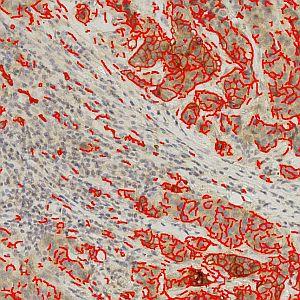
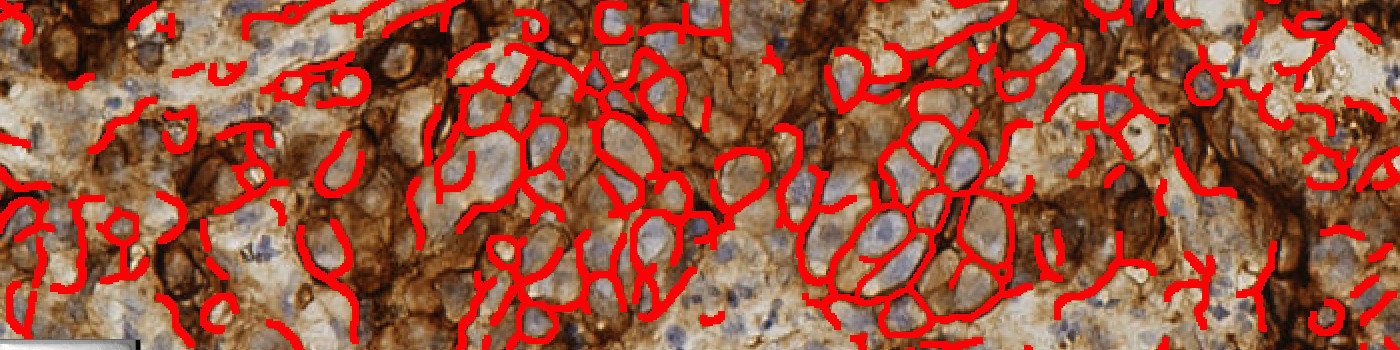
Same field of view as in Figure 1, showing the automatically detected and quantified membrane labeled in red.
Quantitative Output variables
The output from this APP consists of three measured endpoints:
The connectivity is calculated from the size distribution of stained membrane fragments within the ROI, where the size of a membrane fragment is defined as the area of the pixels it is composed of, see [1].
The combination of membrane area for stained membranes, mean stain intensity and the connectivity allows for an accurate evaluation of mean membrane expression in tissue sections.
Methods
To detect the membrane, a DAB color deconvolution of the image is used as input feature together with a polynomial local linear filter. As a post-processing step, membrane fragments that are too small are removed. Finally the detected membrane is outlined with a label and used to calculate the quantitative output.
Keywords
Breast cancer, sodium/proton exchangers, NBCN1, membrane area, mean stain intensity, membrane connectivity, quantitative, digital pathology, image analysis.
References
LITERATURE
1. Brügmann, A., et. al. Digital image analysis of membrane connectivity is a robust measure of HER2 immunostains, Breast Cancer Res Treat 2012, 132 (1), 41-9, DOI