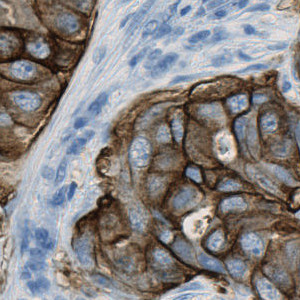
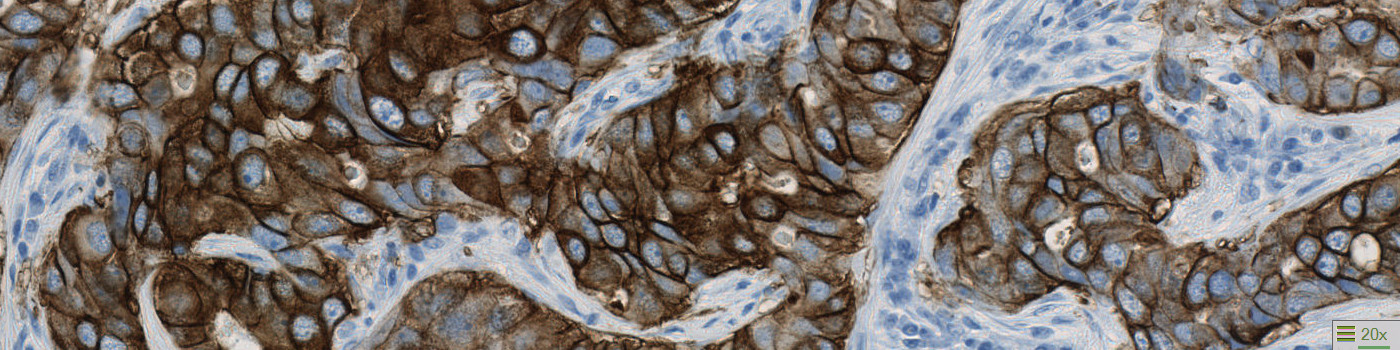
Field of view showing invasive tumor in an image of breast tissue stained by IHC for HER2 (brown).
#10007
The Human Epidermal Growth Factor Receptor 2 (HER2) is a central biomarker in invasive breast cancer, and the HER2 status has both important prognostic implications, and is predictive for the patient’s response to HER2-targeted treatment. According to the guidelines of the American Society of Clinical Oncology/College of American Pathologists (ASCO/CAP), the HER2 status must be determined by genetic and/or protein expression analysis of breast tissue sections using immunohistochemistry (IHC) and/or in situ hybridization (ISH), respectively, see [1].
The widely accepted ASCO/CAP recommendation for manual grading of breast cancer tissue sections stained by HER2 IHC includes four discrete scoring categories 0, 1+, 2+ and 3+, corresponding to negative, negative, equivocal, and positive for HER2 membrane staining, respectively. This scoring principle is based on determination of ratios of numbers of cancer cells with various degrees of membrane staining, and therefore requires quantifications to be made restrictively within tumor regions, and avoiding contributions from stromal and other non-cancer cells.
The present protocol is based on the Visiopharm HER2-CONNECT™ algorithm, see [2], which by automated image analysis determines the connectivity of the HER2-stained membrane in brightfield digital images of breast cancer tissue sections. The connectivity is a continuous measure of the size distribution of stained membrane fragments, and easily converts into the discrete scores 0, 1+, 2+, and 3+. The connectivity is unaffected by the presence of stromal and other non-cancer cells. The HER2-CONNECT™ algorithm therefore does not require manual outlining of the tumor region, and the operator only needs to define an overall region of interest.
Field of view showing invasive tumor in an image of breast tissue stained by IHC for HER2 (brown).
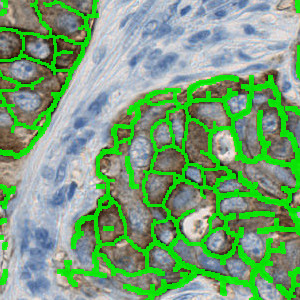
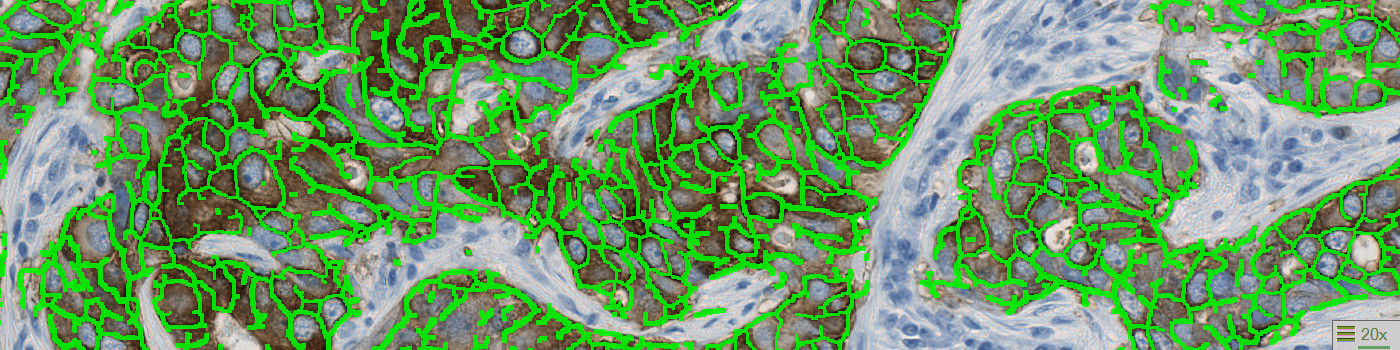
The same field of view as in Figure 1 after classification of positively stained membrane (green label). Even when there is substantial cytoplasmic staining for HER2 in some cells, the automatic detection and quantification is restricted to stained membrane. The presence of stromal tissue does not affect the automated calculation of connectivity and classical HER2-IHC score.
Quantitative Output variables
Three outputs are obtained from this protocol:
The connectivity is calculated from the size distribution of membrane fragments, where the size of a membrane fragment is defined as the area of the pixels its skeleton is composed of. More specifically, the connectivity is the area under a curve with a graphic representation of the ratio of total area of all pixels belonging to membrane segments above a dynamic cut-off versus the ratio of the dynamic cut-off and a predefined maximum cut-off, see [3].
Methods
The image analysis algorithm for this protocol involves several steps. First, a pre-processing step identifies the stained membrane pixels that contribute to linear structures in the image. Then, segmentation rules are employed identifying the membrane segments in the image. The segmentation is based on the intensity of brown in the pixels and the correct dimensions of linearity. By identifying tumor regions from stained membrane segments manual outlining of tumor regions become unnecessary. After identifying pixels that constitute to brown linear structures and make up part of a membrane segment, post-processing steps are employed. The post-processing steps are used to skeletonize the membrane, removing small membrane fragments and merging membrane fragments which are not perfectly connected, see [3]. From the membrane fragments remaining after post-processing, the connectivity can be calculated.
Staining Protocol
Staining protocols have been developed by the NordiQC and are available from their website. It is also possible to use the links below:
HER2-runB17
Keywords
Human Epidermal Growth Factor Receptor 2, immunohistochemistry, membrane analysis, connectivity, HER2-CONNECT, ASCO/CAP guidelines, quantitative, digital pathology, image analysis
References
USERS
This APP was developed in cooperation with Professor Mogens Vyberg from NordiQC and Aalborg University Hospital.
A. Laurinaviciene et al. for the study Membrane connectivity estimated by digital image analysis of HER2 immunohistochemistry is concordant with visual scoring and fluorescence in situ hybridization results: algorithm evaluation on breast cancer tissue microarrays.
LITERATURE
1. Wolff, A.C., et. al. American Society of Clinical Oncology/College of American Pathologists guideline recommendations for Human Epidermal GrowthFactor Receptor 2 Testing in Breast Cancer, J. Clin Oncol 2007, 25 (1), 118-45, DOI
2. Brügmann, A., et. al. Digital image analysis of membrane connectivity is a robust measure of HER2 immunostains, Breast Cancer Res Treat 2012, 132 (1), DOI
3. Brügmann, A., et. al. Membrane connectivity as a robust measure for the HER2 IHC score
4. Laurinaviciene, A., et. al. Membrane connectivity estimated by digital image analysis of HER2 immunohistochemistry is concordant with visual scoring and fluorescence in situ hybridization results: algorithm evaluation on breast cancer tissue microarrays, Diagn. Pathology 2011, 6 (1), 87, DOI